5 key performance indicators in reverse osmosis operation
Reverse osmosis (RO) is a process that forces a feedwater stream containing dissolved impurities (salts and organics) through a semipermeable membrane into two separate streams: one of removed solids (concentrate or reject) and one of purified water, producing soft permeate water.
As the feedwater passes through the membrane, the ions and organics are left behind in the reject and the permeate remains with 96 to 98 percent fewer impurities. Permeate recoveries are typically limited to 75 percent because of the limited solubility of the dissolved salts left behind in the reject.
The key to the success of any reverse osmosis operation is the design and attention to pretreatment equipment. Aside from multimedia filtration for the removal of suspended particles and colloidals, sodium regenerated ion exchange is occasionally used as pretreatment for RO systems. These softener systems are sized to feedwater hardness and therefore alleviate scale on the RO membranes. Often it is more economical and practical for the end user to replace mechanical softeners with scale inhibitors. A calculation program can take into account the flow rate of the softener, total hardness (as CaCO3), cost of salt, electricity and labor as well as the costs of freshwater and wastewater disposal, to analyze the cost of operation and make the best decision.
In most cases the installation of a softener in a new RO installation is unnecessary and costly. With this information, one could offer the end user significant ROI savings by valving off the ion exchange unit and replacing it with antiscalant technology.
Parameters to monitor in reverse osmosis systems
The five most important parameters to be monitored daily are the silt density index (SDI), differential pressure, normalized permeate flow, percent rejection and pressure drop coefficient. They indicate the fouling potential and extent of fouling and/or scaling, the two major causes of premature membrane element replacement.
1. Silt Density Index (SDI)
The SDI is an on-site measurement of the suspended particles and colloidals in the feedwater. It is used to monitor the performance of the pretreatment equipment. SDI measurements should be taken with pre- and post-multimedia filters, carbon filters, and post-cartridge filters. Pretreatment should be controlled efficiently using the designed flow rates and differential pressure limits for backwash of the equipment prior to the RO and replacement of the cartridge filters to give an SDI before using the membranes of less than 3.0. Filter aids can be beneficial in the reduction of SDI prior to multimedia filtration, improving filter efficiency. However, professionals should be cautious when utilizing cationic filter aids.
2. Reverse osmosis system pressure drop
“As long as the flows and temperature are constant, the hydraulic differential pressure will not change unless something physically blocks the passage of flow between the membrane envelopes of the elements (fouling).”
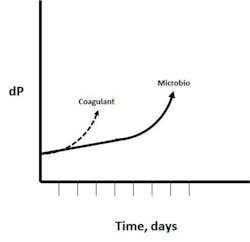
An increase in ΔP can then be isolated as the front of the first stage, lead membrane, last stage at the tail end or both to indicate possible cause. If the first stage shows an increase in pressure, the cause could be particle/colloidals, organic, microbiological or coagulant/polymer fouling. However, if the increase in pressure is quick, it may be an indication of coagulant/polymer fouling, as noted in Figure 1. Coagulant/polymer is due to an overfeed or carryover such as from a clarifier. The cationic coagulant grabs the particle and colloidals with any microbiological matter, forming a quick-fouling matrix. This is avoided with the proper control and monitor to achieve the greater benefits of consistent, lower SDI feedwater. If the last stage shows an increase in pressure, it indicates the cause is chemistry, salt solubility-related such as a carbonate, sulfate, silica or fluoride scale. If this is the case, attention to the antiscalant, incoming water chemistry or the recovery rate needs to be investigated. Also, the incoming water should be tested on a frequent basis. If the proper antiscalant is used to match the incoming chemistry and the recovery rate is set to match the design of the RO and the water chemistry, scaling should not be an issue.
3. Normalized permeate flow
Normalized permeate flow is one of the most sensitive forecasters of trouble in an RO system. Fouling can reduce the permeate flow rate. However, just measuring the permeate flow rate is insufficient because it varies with the feedwater temperature, feed pressure, permeate pressure and feedwater conductivity (total dissolved solids, or TDS). Though all RO membrane manufacturers have their equations for determining the normalized permeate flow, several parameters are needed to develop this complex calculation: temperature, net driving pressure, pressure drop, permeate, feedwater TDS and permeate flow. This calculation corrects for temperature and pressure variations. The calculation, known as normalized permeate flow, adjusts the daily data readings to what they would be if the system were operating at startup pressure at 25°C. This allows for daily comparisons of RO performance. Seasonal feedwater temperature variations can make fouling trends difficult to detect if the normalized permeate flow calculation is not used. For example, RO feedwater derived from surface sources becomes warmer during the springtime. This increase in feedwater temperature affects membrane performance by increasing the permeate flow rate. If the membrane elements are fouling at the same time (fouling causes a decrease in permeate flow rate), it is unlikely that this will be noticed until a change in seasons. At this time, the membrane elements may be severely fouled, with the permeate flow rate severely restricted.
“Since reverse osmosis systems are used to remove dissolved salts, measuring salt (ion) rejection is a direct way to monitor the performance.”
4. Percent rejection
Percent rejection is the monitoring of the permeate TDS. Since RO systems are used to remove dissolved salts, measuring salt (ion) rejection is a direct way to monitor the performance. Salt rejection is the percentage of the feedwater TDS that has been removed in the permeate water. Many plants don’t monitor TDS, and the simplest way to monitor the salt rejection is to measure feedwater and permeate water conductivity. Percent rejection refers to the percentage of TDS (conductivity) rejected by the RO. When the RO membranes are in trouble, percent rejection usually decreases, i.e., the permeate conductivity begins to increase. However, certain foulants can plug up the membrane and increase the percent rejection reading. It can be calculated using the following formula: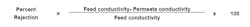
5. Monitoring PDC
Most RO plant operations monitor data from the reverse osmosis operations. This data is valuable in trending the performance of the unit. One of the best ways to trend the data is using the Pressure Drop Coefficient (PDC) versus ΔP, because when PDC is normalized: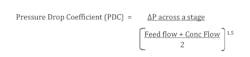
- Normalized permeate flow drops 10 percent
- Salt passage increases 5 to10 percent
- Pressure drop increases 10 to 15 percent
- PDC increases 10 to 15 percent
PDC is more sensitive to changes, making it a good choice for the deciding factor for clean-on-place (CIP) processes. It is important to pick one of these parameters and follow it strictly. If you wait for a 25-percent increase, the foulant is forced into the membrane further, making it harder to clean. This can lead to poor cleaning performance and channeling in the membrane. Creating channeling in the membrane means that cleaning chemicals will follow these paths of least resistance and not clean the entire equipment.
View the infographic of the five key performance indicators in RO operation.
When industrial plant managers know what to look for in the feedwater analyses and potential foulants, understand the design and ask the right questions, they will be in a better position to understand reverse osmosis operations, maximize performance and extend capital equipment life.
Edward Sylvester, Jr., has 36 years of experience in the industrial water treatment industry. As the director of ion exchange and membrane technologies at ChemTreat, Sylvester received company recognition regarding energy-saving projects and account retention. During his tenure, he was heavily involved in the corn and oilseed/ethanol industry, hydrocarbon and chemical industries. His areas of expertise include pretreatment (membrane filtration, ion exchange). Sylvester can be reached at e[email protected].
John Macri, director of sales development for ChemTreat, has more than 25 years of water treatment experience, and specific technical expertise in power, chemical, food and beverage, municipal reuse and high purity water industries has responsibility for the Membrane Products and Services Vertical Sector within ChemTreat, building operational, chemical and system solutions through ChemTreat and its Danaher partners. Macri can be reached at [email protected] or by phone at 804-517-1698.