Improving Paper Mill Feed Water: Pretreatment Filtration Optimization for Reverse Osmosis
By Scott Branum and John Clark
A paper mill in the U.S. Southeast considering use of reverse osmosis (RO) for a boiler feed water application realized the performance of an RO system is highly dependent on quality of the applied water. A prior system was composed of clarifiers, multimedia filters and demineralizers – half of which were cation and anion fixed bed trains, and the other half mixed bed trains.
As the idea of installing an RO system was being investigated, it was expected the RO primary inlet would be supplied by an existing filtered water storage tank. Mill operators understood a more reliable water supply would be needed. With that and the fact membrane fouling can be costly in mind, they had two primary concerns:
To help answer these questions, a Six Sigma project to track goals and filtered water quality was initiated in 2005.
Pretreatment
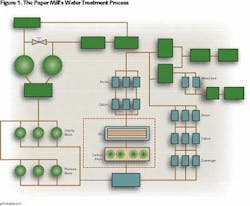
Clarified river water is the sole source of process water for the mill, with two up-flow sludge blanket clarifiers designed to treat 8,500 gpm each. The actual flow through each clarifier averages 9,500 gpm, but with peak flows exceeding 11,000 gpm. The mill was using turbidity to monitor filter effluent quality. Although the performance goal for the mill water – clarified water – is to maintain turbidity at less than 2 NTU, the excessive flow demands of the mill result in turbidities between 2 and 3 NTU for 80% of the time; or as high as 50 NTU during extreme upset conditions. Such fluctuations present an ongoing challenge for the filtration and demineralization processes (see Figure 1).
The mill has six multimedia filters in parallel service upstream of the demineralizers. Three of the vessels are older gravity filters, while the newer filters are pressurized. The water quality of the two sets of vessels is comparable. Filtered water is sent to a storage tank and serves as the makeup for each of the demineralizers.
Filter backwash frequency would be adjusted manually based on the combined turbidity reading from the filtered water storage tank. This control methodology didn't always provide the filtrate goal of less than 0.50 NTU, and filtrate quality would often exceed that target for days, if not weeks at a time. It was understood that poor RO feed water quality could result in membrane fouling, increases in cleaning frequency, and an overall increase in the cost of operation. Since previous work had shown particle counters to be a sensitive measurement of filter effluent quality, as well as very responsive to the types of water quality changes that affect Silt Density Index (SDI), it was decided to use particle counting technology to evaluate each filter.
Particle Detection
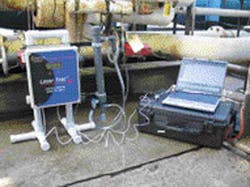
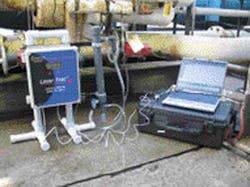
A particle counter is an online instrument that uses a laser light source to count and size particles in a flowing water sample. As the sample stream flows through the laser path, particles create shadows on a sensor which are converted to electrical pulses proportional to the particle size. The data is then expressed as counts/ml (particles per milliliter) for selected size ranges in microns (i.e., 2-5 μm, 5-10 μm, 10-15 μm, etc.). The particle counter used for this study has the sensitivity to detect one particle per milliliter of 2 μm in diameter, which equates to 4 ppt (parts per trillion) on a volumetric basis.
In this study, the results from the particle counter proved to be of great value. Using the particle counter, the mill was able to recognize which filters were problematic, and identify and optimize the following:
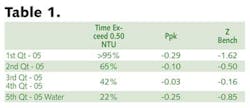
As a result of the project, and changes in pretreatment operations, overall filtered water quality improved dramatically as indicated in Table 1. In this table, the terms "Ppk" and "Z Bench" are Six Sigma process capability measurements. The second is a way to report PPM, or Defect Per Million Opportunity (DPMO), with Z Bench for a process indicating performance relevant to lower and upper specifications. Likewise, Ppk is the distance from the sample mean to the nearest specification limit, using long term data, divided by three standard deviations. Thus, a Ppk of 1.33 means the process, if centered, barely complies and any variation, causing mean shifts, likely will result in defects.
Filter Aid Feed Control
An additional consideration of the Six Sigma project was to determine if current multimedia filters could produce a final effluent quality suitable for RO inlet feed. In an effort to further optimize filter performance, a cationic filter aid was fed ahead of the multimedia filters using a Streaming Current Monitor (SCM) for dosage control.
The SCM is a continuous sampling, on-line instrument that measures charge and provides the ability to maintain precise coagulant dosage for optimum charge neutralization under widely varying raw water conditions. The operator (or an automatic control device) simply adjusts coagulant feed to maintain the charge "set point" that produces optimum treatment results. Any changes in feed water quality will result in a change in the net charge of the sample, thereby requiring an adjustment of chemical feed rates to maintain optimum charge.
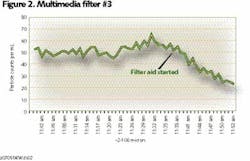
The results were dramatic. The graph in Figure 2 shows the initial decrease in total particle counts after the filter aid feed was started.
SDI Test vs. Online Measurements
Because of the likelihood of sudden upsets, the mill wanted an online instrument that would alert them as early as possible to any small changes in filtrate particulate concentration. Of course, to be meaningful for RO pretreatment, the online measurement needed to be responsive to changes in SDI below 5. Onsite studies were performed to see how capable a particle counter and a turbidimeter would be of serving this purpose. The results showed the particle counter to be an excellent predictor of SDI values while the turbidimeter used in this study was largely unresponsive to changes in SDI less than 5 (see Table 1).
Table 1 shows the correlation developed with the particle counter at this mill. It should be noted that since the particle counter has a lower detection limit of 2 μm, and traditional SDI uses a 0.45-μm filter pad, this correlation is obviously dependent upon having a comparable change in concentration of particulates in the 0.45-to-2 μm range (the undetectable range for the instrument) when compared to particulates at least 2 μm in size. This correlation is considered site and application specific, and the particle counter is not serving as an absolute replacement for traditional SDI, but rather as a way to continuously monitor, and provide some assurance, that, the quality of RO feed water remains acceptable between SDI testing.
RO Operation
The RO system was installed in the fourth quarter of 2006. Additional pressure filtration was added upstream of the RO due to unpredictable spikes in filtered water particle counts. These types of spikes are directly related to mill water upsets, and the additional filtration provides added protection for the RO membranes.
Based on the correlations of particle counts and SDI values, the particle counter is now tied into a relay that will shut down the RO unit if filtered water quality exceeds 150 counts/ml for more than 20 minutes. The particle counter is used also to identify the need for filter backwashing. Typically, backwashing occurs when the total counts approach 80.
And in addition to using the SCM to control the cationic filter aid, it's also used to trip the RO unit if the measured charge exceeds +10 Streaming Current Units (SCU) for more than 30 minutes. This helps protect the RO membranes from irreversible fouling due to cationic polymer overfeed.
Conclusions
Excessive water demands continue to challenge the water treatment processes at the mill, and spikes in clarified water turbidity are very difficult to predict. Despite periodic adverse conditions mentioned previously, the particle counter and streaming current technologies have helped optimize the existing multimedia filtration system, and reduced the fear and incidence of RO membrane fouling.
Many areas of improvement were identified as a direct result of the studies:
- The particle counter has proven to be a reliable predictor of SDI for the mill,
- It has reduced the need for frequent manual SDI tests,
- Using the Streaming Current Monitor, cationic filter aid dosage has properly controlled and filter water quality has improved dramatically, and
- Membrane fouling scenarios were reduced by automatically taking the RO offline during upset conditions, which ultimately: protects the membranes; improves RO reliability; and increases future savings to the mill.
The RO unit has been online and using filtered surface water feed for more than seven months. In that time, there has been only one membrane cleaning which wasn't required due to performance, but served as preventive maintenance and learning experience for the operators. RO permeate flow rate and quality remain unchanged from start-up, and normalized data shows that there has been little to no change in overall RO performance.
About the Authors: Scott Branum is quality control manager of Buckman Laboratories, of Memphis, TN, which served as specialty chemical suppliers on this project. Contact: 800-272-8244 or [email protected]. John Clark is industrial sales manager at Chemtrac Systems Inc., of Norcross, GA. Contact: 800-442-8722 or [email protected]
