In Situ Nitrogen Removal Demonstrated at Stillwater Mine
Nitrate is a pervasive contaminant typically present in mining waters from blasting activities using ammonium nitrate or after cyanide degradation. A 2004 pilot test was run at the Stillwater Mine in Montana to develop in situ biodegradation of nitrate in the groundwater system downgradient - or downstream - of the Stillwater Valley Ranch (SVR) percolation ponds. This treatment method can significantly reduce nitrogen concentrations with minimal capital equipment or minimal modification to existing treatment facilities.
The Stillwater water treatment system uses a series of anoxic biotreatment cells (ABCs) to remove excess nitrate-nitrogen in mine water prior to discharge. These are packed-bed reactors with addition of an external carbon source, usually methanol. Features include natural reactor media, often found onsite; low-temperature operation (as low as 2°C); simple yet flexible reactor configuration (in-ground, upflow, insulated); and low excess phosphate concentration to enhance microbial activity. Nitrate is often cut 90% or more, but ammonia isn’t affected by the anaerobic bacteria in the ABC and comprises most of the nitrogen load in treated mine water. When this infiltrates to groundwater, the ammonia may be converted to nitrate by aerobic bacteria in the unsaturated zone.
In late 2003 and 2004, due to changes in water handling and mine operations, nitrogen concentrations in groundwater downgradient of the SVR ponds gradually increased, approaching the total nitrogen concentrations in treated water (7-8 mg/L). This suggests ammonia in the ABC effluent was being oxidized to nitrate after infiltration - prompting the study leading to this test.
The pilot test focus was to remove nitrate in situ following treatment and infiltration. This could address the total nitrogen load in groundwater - i.e., nitrate remaining after ABC treatment plus ammonia oxidized to nitrate.
Test Operation
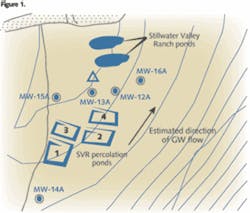
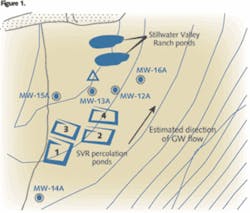
Methanol is added to the ABC water treatment plant at the Stillwater Mine to provide carbon for denitrifying bacteria, which reduce nitrate to nitrogen gas (denitrification). On March 12, 2004, methanol flow to the ABCs was increased to about 50% above the stoichiometric requirement to provide additional carbon for in situ denitrification in the groundwater. Concentrations of nitrate, ammonia and TOC were measured weekly in the percolation ponds, shown in Figure 1. Four downgradient monitoring wells also were sampled during the test: MW-12A, MW-13A, MW-15A and MW-16A.
The active portion of the test July 11, 2004, when methanol levels returned to normal and treated water was routed away from the ponds. Groundwater monitoring, however, continued until May 2005.
TOC Results
TOC breakthrough from methanol was first seen at MW-16A in June and at MW-12A in July, which means groundwater transit time was three to four months. These wells are 250-450 feet from ponds 1 and 3 (see Figure 1), where the high-TOC groundwater infiltrated. After excess methanol addition was stopped in July, TOC should have been measurable at these wells until at least October 2004. As anticipated, was below the detection limit in November and that at MW-12A was only 1.3 mg/L.
Nitrogen Results
With excess TOC now available at the monitoring wells downgradient from the percolation ponds, in situ denitrification was expected to develop - and it did. Nitrate concentrations at the two monitoring wells specifically targeted in this test (MW-12A and MW-16A) are shown in Figure 2. Important points illustrated in this chart include:
• Nitrate concentrations at MW-12A and MW-16A significantly decreased during the test. For example, the concentration at MW-12A decreased from an average of 9.0 mg/L before the test to 5.8 mg/L during the test.
• Background nitrate concentrations in groundwater (measured at MW-14A, see: Figure 1) remained steady at about 2 mg/L.
• Nitrate concentrations decreased after ABC effluent was not discharged to the SVR ponds, beginning in early 2001. Concentrations were near the background level of 2 mg/L during 2002, began rising in 2003 and increased significantly when ABC effluent was primarily discharged to the SVR ponds beginning in October 2003.
• Nitrate spikes seen in February and June 2004, especially at MW-12A, are higher than the average total nitrogen concentrations in the ABC effluent during these times. Possible explanations are: 1) a nitrate spike due to ABC treatment upsets, 2) high groundwater levels which may have flushed ammonia from soils into groundwater, or 3) precipitation events which may have flushed ammonia from soils into groundwater. Subsequent analysis showed that these spikes were probably due to high groundwater levels.
• Nitrate concentrations at the monitoring wells reached a minimum in October 2004, three months after the test ended. Had the test not ended in July, it’s believed concentrations would have remained at or below this historically low level.
• No ammonia breakthrough was seen at the monitoring wells. This was a potential concern from the reducing conditions created after infiltration of high-TOC treated water.
• Total nitrogen (nitrate plus ammonia) at the monitoring wells was less than before the test and at the SVR ponds. The total nitrogen concentration at MW-16A averaged 4.0 mg/L during the test, compared to 9.2 mg/L before and 7.6 mg/L in the percolation pond during the test.
Interpreting Results
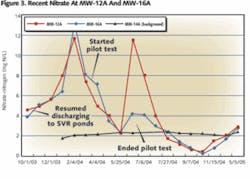
Figure 3 best illustrates effects of the pilot test, focusing on the most recent nitrate results for MW-12A and MW-16A. Following a several-month lag, separate effects of resuming discharge to the SVR percolation ponds, starting the pilot test and ending the pilot test can readily be seen.
Although extra sampling was done only at MW-12A and MW-16A, MW-13A and MW-15A are probably also influenced by the SVR ponds (see Figure 1), especially since water was infiltrated at Ponds 1 and 3. During the test, nitrate concentrations at MW-13A and MW-15A were monitored monthly and they also decreased. Beginning in late July 2004, results for all four downgradient wells were at or below the background level (the nitrate concentration of about 2 mg/L at MW-14A), and were at or near historically low levels. This trend continued throughout the rest of 2004 and early 2005. Again, nitrate concentrations reached a minimum in October 2004, after high-TOC treated water had infiltrated to groundwater for several months.
TOC data show a travel time from the SVR ponds to MW-12A and MW-16A of three to four months. This predicts that nitrate concentrations would begin decreasing three to four months after the test started in March 2004. In fact, nitrate concentrations at MW-12A, MW-13A, MW-15A and MW-16A all decreased significantly in July 2004, or four months after the test started.
The pilot test was stopped in July 2004, when methanol addition at the water treatment plant was reduced. Accordingly, nitrate concentrations at MW-12A, MW-13A, MW-15A and MW-16A all increased in November 2004 (four months after the test ended), and continued to increase until the last sampling event in May 2005.
ABC treatment efficiency was higher than normal during the pilot test, with effluent nitrate concentrations averaging about 1 mg/L. This increased efficiency may account for part of the total nitrogen decrease at the monitoring wells.
Conclusion
The test at Stillwater achieved a significant decrease in groundwater nitrate concentrations. A “stretch goal” of 1 mg/L of total nitrogen in groundwater was met, which is below the background level. This treatment method has the potential to significantly reduce nitrogen concentrations with minimal capital equipment or minimal modification to existing treatment facilities.
About the Author: Dr. Mark Reinsel is president of Apex Engineering PLLC, a small consulting firm in Helena, Mont. He has 21 years of experience in consulting, industry and academia, with recent projects focusing on treating industrial wastewater, groundwater and drinking water through biological, chemical and physical methods. Contact: 406-458-8933 or [email protected].


