Online Floc Meter Provides Water Treatment Control
By Charles Veal

New developments in control strategies and instrument design are needed to overcome some of the limitations of monitoring and controlling the treatment process. The flocculation process has often been overlooked from the lack of reliable instrumentation that can characterize the process.
In conventional water treatment, the optimum floc is that which is easily settled and filtered. The size and strength of the floc particles will determine the efficiency of the sedimentation and filtration processes. A chemical floc formed from aluminum hydroxide precipitate may give a great appearance of a large floc, but may not settle well and shear easily. A weak floc that shears easily can penetrate the filters and degrade the finished water quality.
An online floc meter, the Micrometrix Floc-Meter Model FM21, was evaluated recently at pilot and plant scale to determine if the instrument could characterize floc particles and the flocculation process. Readings from the instrument were taken at different stages of the process and for various coagulant dosage levels. Measurements of the flow rate, pH, turbidity, streaming current and coagulant pump settings were also recorded for cross-reference.
The floc meter responded to the tests as predicted and was successful at characterizing the floc for various levels of coagulant and at different stages in the process on the pilot plant. This data also agrees with a full scale plant study where the samples were taken at different stages of the process.
The meter, with its flow-through design, can be used online as part of a control strategy to optimize coagulant dosing. The instrument uses fiber optics to measure floc particles in a flowing suspension.
Background
Plant and lab data have shown that optimizing coagulation will form floc that is large and easily settable. Historically, operators have been limited to visual observation to verify and characterize flocculation performance. Filtered turbidity and particle counts give a good indication of filter performance, but may not indicate optimum flocculation. The excessive lag time in a conventional plant also makes it difficult to implement a control strategy using only filtered turbidity.
Streaming current instruments and jar testing have been the traditional tools for adjusting and controlling coagulants. While streaming current meters provide information on the charge or zeta potential of the colloidal particles, they don't measure how well the process is performing.
The floc meter can assist in providing feedback to determine the proper setpoint for a streaming current monitor (SCM). This technique can be accomplished manually or automatically in a multi-sensor "expert system" approach. Other measurements that help characterize the process are flow, pH, turbidity and particle counts.
For online applications, a process stream can be sampled at a convenient point and passed directly through the flow cell of the floc meter, often by gravity flow. This provides a simple means of monitoring the state of aggregation of particles. Once the optimum reading is established, departures from this condition are immediately apparent by changes in the instrument's reading or output. The output is used to activate an alarm, or can be used for process control to adjust the streaming current setpoint or change the dosing rate of the chemical feed pump.
Technique
The floc meter illuminates the flowing suspension by a narrow beam of light extended from a fiber optic so that a small sample volume of the order of one cubic millimeter is examined. The number of particles in the light beam is continuously changing since the suspension is flowing. These fluctuations in the intensity of transmitted light are transmitted to a sensitive photodiode. The light intensity is converted to a voltage proportional to the variations. The output voltage has a large DC component corresponding to the average transmitted light intensity (related to the turbidity of the suspension) and a much smaller fluctuating (AC) component due to the random variations in particle number and size. The signal produced by the AC component is referred to as the Flocculation Index.
Researchers have shown the technique can be used to calculate the mean particle size for flocculated/coagulated suspensions. They have also shown good coincidence with experimental results when compared to microphotography.
The Flocculation Index value shows a substantial increase as particles aggregate. Corresponding changes in the DC value (or in the turbidity) are typically much less significant. The reading gives a very useful empirical indication of the state of aggregation and enables optimum dosages of flocculants and coagulants.
A major advantage of the Floc Index is that it is almost entirely unaffected by contamination of the tube walls in the flow cell. This effect causes the same proportional change in the DC and AC values, so that there is no change in the Floc Index. For a given suspension, the Floc Index value depends only on the setting of electronics gain.
Very small changes in the state of aggregation of a suspension can lead to changes of several percent or more in the Floc Index, which provides a very useful check on the day-to-day reproducibility of flocculation. A reading that is lower than expected for a flocculated suspension is a clear indication of disaggregation. This change in the Floc Index reading may indicate a loss of coagulant or severe underfeed condition in the process.
Plant Evaluation
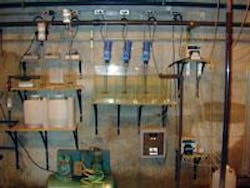
An evaluation of the floc meter was conducted at the Quarles Water Treatment Plant in Cobb County, GA, to confirm the instrument can be used to monitor changes in flocculation at full plant scale.
In these experiments a peristaltic pump was used to pull samples through the floc meter at a flow rate of 25 ml/min. The sample tubing size was 1/8". Samples were taken at various stages of the process to observe differences in flocculation. The turbidity of the source water was 3 NTU.
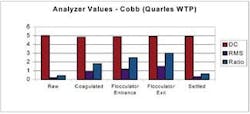
The values recorded in this experiment corresponded well with visual observations and expected results. The maximum Floc Index value was recorded at the exit of the flocculator and the minimum reading was on the raw water. An increase in the Floc Index values are noted as the floc has time to form through the process. It is interesting to note that floc starts forming immediately in the mixing unit just seconds after coagulation.
About the Author
Charles Veal, President of Micrometrix Corp., has 18 years experience in the water treatment field and founded Micrometrix in 1999. He holds several patents for particle measurement and streaming current sensor technologies. Veal is a member of AWWA, ISA, TAPPI, ACS, and WEF.