Membranes Operational Warning Signs, Troubleshooting, and Cleaning

By Jim Summerfield
In normal operations, the reverse osmosis (RO) membrane in spiral wound elements can become fouled by mineral scale, biological matter, colloidal particles and insoluble organic material. Deposits and other material can build up on the membrane surfaces until they cause loss of normalized permeate flow, loss of normalized salt rejection, or both.
There are many factors involved in RO system fouling and many operational warning signs that, when monitored and documented, provide the owner and operator with valuable information on how to troubleshoot the problem.
Routine maintenance and good record keeping is an important part of effectively operating an RO membrane system. When a system exhibits high salt passage, operational data must be reviewed before the problem can accurately be identified. Operational data such as total flow (feed and permeate), feed pressure, feed water analysis, inter-stage pressures, chlorine concentration (or other oxidizer), percent recovery and pre-treatment operations, alone or in combination, could have an impact on the RO membrane system resulting in high salt passage. A single data point will not provide enough information to allow for an accurate assessment of the system.
Startup Checklist
Prior to actually starting the RO membrane system, review the pre-startup checklist provided by the system builder. If this checklist is not available, ask them to provide one. The pre-startup checklist will enable you, as an operator of the system, to verify that the materials of construction are correct, valves and gauges are in place, fittings are tight and planned instrumentation is installed.
Data collection during the initial start up of the RO membrane system is very important. The data collected during the initial 5-7 days will be the basis for which all other data is compared. Salient data to collect includes: raw water analysis, feed water analysis including TDS, SDI and turbidity, temperature and pH. Additionally, the permeate and reject flow rates, as well as the permeate reject TDS and conductivity must be collected. Once this baseline is established, the pursuant normalized data will be much more meaningful.
Record Keeping
A good maintenance program begins with good record keeping. An operating log book or electronic database for documenting the temperature, pretreatment process conditions, chemical additions, chemical residuals, operating pressures, recovery rates, flow rates and salt rejection will enable the operators to track changes in the RO membrane system operations and performance.
Ideally, the system that is used to track the RO membrane system performance will have trending capabilities, allowing the operators to graphically represent the performance over time.
This data must now be normalized to a standard set of conditions. In order to distinguish between normal operating changes and real performance changes, the permeate flow rate and system salt rejection must be compared to a reference performance (baseline) or a reference based on design. This is where the startup data is valuable. Without the initial data, the baseline to which the normalized data is compared will be limited to the designed performance, not the actual performance. Membrane manufacturers have data normalization software available that can be installed on nearly any computer system.
Troubleshooting
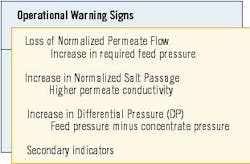
Having the right information about your RO membrane system and the knowledge to interpret that information correctly is the key to successful troubleshooting. There are three typical primary indicators of trouble and multiple causes wound up in these primary indicators. The primary indicators are:
1. Loss of normalized permeate flow
2. Increase of normalized salt passage
3. Increase in system differential pressure
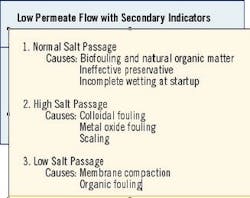
Loss of Normalized Permeate Flow
The loss of normalized permeate flow is usually manifested by the corresponding increase in feed pressure required to produce the designed volume of water.
This problem can be coupled with changes in salt passage, which are secondary indicators of a problem.
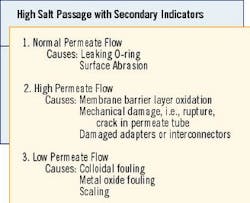
Increase in Normalized Salt Passage
An increase in normalized salt passage as measured by a particular salt or conductivity measurement is an indicator of an operational issue. This can be coupled with secondary indicators such as changes in normalized permeate flow and feed pressure. The causes range from leaking o-rings on the interconnectors to surface abrasions to membrane layer oxidation to scale. Some of the problems are permanent and can't be fixed and other problems are fixable. Ultimately, all problems are avoidable.
For example, interconnector o-rings are frequently not lubricated and seated properly within the permeate tube causing feed water to pass by the o-ring and leak into the permeate. This results in higher than predicted conductivity for the permeate with minimal impact on the permeate flow rate. Likewise, abrasions on the surface of the RO membrane (likely caused by sand or other abrasive material in the feed water) can cause poor salt rejection with minimal impact on the permeate flow rate.
If you suspect an o-ring leak, probe your RO system and generate a permeate conductivity profile for each pressure vessel. The resulting profile will help pinpoint the problem area.
Polyamide based reverse osmosis membranes are subject to irreversible damage by oxidants such as chlorine, bromine, ozone and peroxide. When the membrane surface is oxidized, the salt rejection decreases and the permeate flow rate increases. Occasionally, during the early stages of oxidation, the salt rejection may actually improve slightly before getting worse. It is prudent to ensure that all oxidizing chemicals in the feed water are neutralized completely before the water enters the RO system.
Higher than predicted normalized salt passage combined with a low permeate flow rate is a typical indicator of colloidal or metal oxide fouling, or scale. Salt or mineral build-up on the RO membrane barrier layer will cause high salt passage resulting in poorer water quality.
Increased System Differential Pressure
System differential pressure is feed pressure minus the concentrate pressure. Typically, the system differential pressure is a value that is used to gauge system performance deviations, just as permeate flow and salt passage.
Differential pressure can be measured across a system, in a single stage or even a single pressure vessel. Depending on where the abnormal differential pressure is observed, there are multiple typical causes and secondary indicators are likely.
Cleaning, Maintenance
The guidelines for RO membrane system cleaning are somewhat variable from manufacturer to manufacturer, but the typical rules of thumb are as follows: Clean your system: 1) If the normalized salt passage increases by 5%, 2) If the normalized permeate flow decreases by 10%, 3) If the normalized differential pressure increases by 15%.
Normalized values are used for this interpretation and are the baseline data for which all data should be compared. It is essential that the normalized data be used, because if you base your cleaning requirements on actual differential pressure measurements and your feed water temperature decreases by 10 degrees F, the normalized differential pressure has not changed, but actual differential pressure has increased.
Membrane Cleaning
Once the problem area has been identified, based on the aforementioned warning signs, one must decide how to clean the membrane system and determine how to prevent it from happening again. In almost all cases, system performance can be re-established by using sodium hydroxide for organic fouling and hydrochloric acid for scale. A weekly maintenance dose of a compatible biocide will keep biological fouling to a minimum.
Acid cleaners and alkaline cleaners are the standard cleaning chemicals. The acid cleaners are used to remove inorganic precipitates and iron, while alkaline cleaners are used to remove organic fouling including biological fouling. Sulfuric acid is not recommended for cleaning because of the risk of calcium sulfate precipitation in the system. Reverse osmosis permeate is the preferred water quality for system cleanings, however pretreated raw water may be used. Many raw waters are highly buffered and may result in increased acid and caustic usage to achieve the desired pH of 2 and 12, respectively.
Although many membrane manufacturers have different recommended cleaning guidelines such as pH, temperature and flow rates, generally the maximum cleaning temperature is 50 degrees C. However this is dependent on pH. Some membrane manufacturers allow for more aggressive cleaning conditions and have set higher than typical pH and temperature limits for cleanings.
There are recommended cleaning flow rates for various element sizes that will facilitate the cleaning process. For many 8-inch elements, it is recommend that a low-flow cleaning is conducted first.
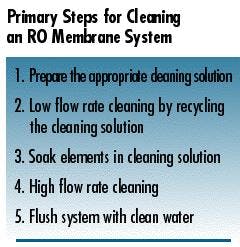
Consult your membrane supplier for specific recommendations. Refer to Table 2 for the primary steps of conducting an RO membrane system cleaning.
Use only enough pressure to compensate for the pressure drop from the feed to the concentrate. The pressure should be low enough that essentially no permeate is produced. A low feed pressure minimizes redeposition of dirt on the membrane. Low flow and low pressure cleaning is typically conducted at 50% of the recommended high-flow cleaning flow rate. Also, dump the cleaning chemical as required to minimize dirt and debris in the cleaning solution and maximize cleaning chemical effectiveness.
If required, it is recommended to soak elements in the cleaning solution. This may improve the effectiveness of the cleaner. The high-flow cleaning step flushes out the foulants and contaminants from the RO system. The recommended flow rate for high-flow cleaning is 35-45 gpm per pressure vessel. Finally, the RO system needs to be flushed with clean water before being put back in to service.
Cleanup, Disposal
When handling acids and bases, necessary precautions must be taken to ensure the safety of yourself and others around you. Please ensure that the acid and base storage areas are separate and the area cleaned of spills. Always wear the appropriate personal protective safety equipment when handling chemicals. If you are not familiar with the recommended equipment, consult the appropriate MSDS, which should be located in a centralized area within your facility.
Although most cleaning chemicals for RO membrane systems pose very little toxicological or environmental exposure hazards, it is always best to consult the local wastewater plant superintendent before initiating a cleaning procedure using a new chemical. The wastewater authority will inform you of the limits for certain chemicals into the sewer system and guide you how to be dispose of the cleaning chemicals properly. Generally, the scale or foulant that is removed from the membranes in the RO system is of no concern, rather the chemicals that are used in the cleaning may cause some wastewater treatment plant upsets if discharged in very large quantities.
About the Author: Jim Summerfield is a Technical Service Specialist with the Dow Chemical Co., based in Midland, MI. He has B.S. Business-Chemistry and Masters in Business Administration degrees from Saginaw Valley State University. For the past two years, his work has focused on industrial demineralization applications using both membrane separation technology and ion exchange technology. This article was adapted from a paper presented at the 63rd Annual International Water Conference.
About the International Water Conference: The International Water Conference is the world's premier Conference on Industrial Water Treatment. IWC has been conducted by the Engineers' Society of Western Pennsylvania (ESWP) since 1940. IWC is attended by the leading experts, engineers and academics in the USA, Canada and Europe who are actively pursuing advancements in industrial water treatment and processing technology . The Conference and Exhibition is held annually in October, in Pittsburgh PA. For continually upgraded agenda, and registration information, visit eswp.com/water.html.