Advances in analytical techniques impact consumer concern over drinking water quality

Water quality and the perception of water quality is a complex issue. Consumers take high quality water for granted, but they also are heavily influenced by the thought of contamination in their water. This is one reason for the large increase in bottled water sales and the sale of point-of-use (POU) treatment devices over the last 40-plus years. Three major factors have influenced this and they have now converged.
First, the Environmental Protection Agency (EPA) promulgated the Safe Drinking Water Act (SDWA) in 1974 as a result of concern over maintaining drinking water quality. Second, analytical methods continued to improve in sensitivity, making measurements now routine at levels unheard of 40 years ago. Third, with the advent of the Internet and environmental interest from social and print media, public interest in water quality has blossomed.
This article describes how the intersection of the SDWA and the improvement in analytical methods has created the “perfect storm” that may develop as a result of monitoring required beginning in 2013 under EPA’s 3rd Unregulated Contaminant Monitoring Rule (UCMR3).
Beginnings of drinking water measurements
In the early 1970s, analytical chemists routinely focused on part per million (ppm or mg/L) levels of measurement in drinking water. The SDWA has been amended several times since its promulgation in 1974, and many additional drinking water regulations have been promulgated, each time increasing the number of contaminants being monitored and increasing the emphasis on low level measurements of potential contaminants. In the current decade we routinely measure contaminants in water at the low part per trillion (ppt) level. So over the last 40-plus years we have seen over a one million fold increase in instrument sensitivity for water quality measurements.
As early as 1980, with the advent of the first regulations for volatile organic compounds (VOCs) in drinking water, both the public and drinking water utilities began to focus on part per billion (ppb or ug/L) levels of contaminants, such as trihalomethanes.
By the 1990s, this became routine for laboratories measuring not only for organics, but also for inorganics such as trace metals. In the mid-1990s, EPA published numerous methods for drinking water analysis as part of the growing increase in the number of regulated contaminants in drinking water. These methods continued the trend towards increased analytical sensitivity, as many of them had reporting limits that were in the sub ppb range.
Unregulated Contaminant Monitoring Rules
In 1996, the Safe Drinking Water Act was amended and implemented not only additional monitoring requirements for utilities, but also set the framework for what is referred to as the Unregulated Contaminant Monitoring Rules (UCMR). Under the UCMR framework the EPA was required to mandate monitoring of up to 30 analytes every five years to determine potential future regulations.
Selection of candidates for the monitoring is to be based on a list of potential contaminants for which health effects were known but for which there was limited drinking water occurrence data. In addition, the agency seeks recommendations from other entities (including the public) for additional contaminants for consideration.
These recommendations tend to be heavily influenced by other monitoring programs, which may include university research, individual state programs and findings, industry studies and even the research conducted by non-governmental organizations (NGOs). In the prior amendment to the SDWA, Congress had mandated regulation of a specific set of 83 contaminants, without consideration for the likelihood of occurrence in drinking water, so the UCMR program represents a major step forward in understanding drinking water risks, but the impact of outside entities on the process is magnified by media issues.
A good example of this trend was perchlorate, which was included in UCMR1 (2001-2005). In the early 1990s, analytical methods for perchlorate were only capable of measuring at the 100 ppb range, but by the mid-1990s the California Department of Health Services (now the California Department of Public Health) had developed and implemented a method for perchlorate with a sensitivity of 4 ppb and discovered perchlorate in several places in Southern California. This prompted numerous additional investigations and the discovery of perchlorate as a widespread contaminant in drinking water in California.
First round of rules
In 2001, the EPA promulgated the first round of UCMR. Most of the constituents in UCMR1 came off of EPA’s list of potential contaminants, but perchlorate was added to the required list as a result of the widespread occurrence in California and Nevada and also influenced by widespread publicity around this contaminant, and the ability to measure at the 4 ppb level.
By the time UCMR1 monitoring was completed in 2005, perchlorate was determined to be widespread in drinking water in numerous locations across the country (approximately 5 percent of systems had perchlorate detected at least once). This led to more than 10 years of discussion within the regulatory community on the potential regulation of perchlorate in drinking water, and at the same time kept perchlorate in the news, increasing public perception and concern.
In 2013, the EPA will announce a proposed Maximum Contaminant Level (MCL) for perchlorate. It is worth noting that many of the other constituents monitored in UCMR1 were determined to not occur with enough frequency to be regulated.
In the same timeframe, 2001, the USGS completed and published a major study of pharmaceuticals and personal care products (PPCPs) in the nation’s streams and demonstrated the widespread occurrence of PPCPs in wastewater effluents. Numerous other researchers expanded on this work, including our own group, and in 2008, the Associated Press published a series of stories on “Drugs in the Nations Waters” that prompted huge public interest in this arena. It is worth noting that most of the detections of any PPCPs in drinking water, even when heavily influenced by wastewater sources, have been in the ppt range, levels we could not even measure in the 1990s.
Round two
In the second round of the UCMR program, for which monitoring occurred from 2008-2011, and for which the author’s lab conducted a significant portion of the nation’s monitoring, EPA included the compound N-nitrosodimethylamine (NDMA), with a reporting limit of 2 ppt, a factor of 1,000 lower than the reporting level for perchlorate in UCMR1. This was driven not only by the analytical method, but also by the fact that the EPA had developed a risk assessment for NDMA with a 10-6 risk level of 0.7 ppt.
Also included in UCMR2 were the acetanilide herbicides and their degradation products, but these had reporting levels of about 0.5 ppb, so not nearly as low as NDMA. By the time UCMR2 monitoring was completed in 2011, we found that NDMA was present in more than 25 percent of public water systems, while most of the other constituents were detected infrequently or not at all. EPA has indicated that they are considering adopting a nitrosamine regulation for drinking water within the next few years. This lack of detection of most compounds has become important for the upcoming UCMR testing, UCMR3, scheduled to begin in January 2013 and last through 2015.
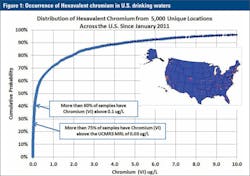
In 2010, the Environmental Working Group (EWG) issued a press release on the results of monitoring of hexavalent chromium (of Erin Brockovich fame) in the drinking water of 35 cities across the U.S. with detections above 20 ppt in 31 of the 35 cities. At the time, the state of California had a proposed Public Health Goal (PHG) for hexavalent chromium of 60 ppt and, in 2011, the PHG was promulgated at 20 ppt.
The EWG press release garnered wide interest, and in part because of that press coverage, EPA suggested voluntary monitoring of hexavalent chromium in 2011, and also elected to include hexavalent chromium in UCMR3. Data from the 2011 voluntary monitoring program confirms the widespread occurrence of hexavalent chromium in drinking water, with more than 70 percent of over 10,000 samples tested by our lab from locations across the U.S. having detectable hexavalent chromium (Figure 1). This sets the stage for the UCMR3 monitoring program.
New regulations coming
In prior UCMRs, the EPA set reporting limits based largely on the known health reference levels. However, the lack of detection of the acetanilide herbicides, coupled with the extensive detection of NDMA in UCMR2 contributed to the EPA’s decision to change the paradigm for UCMR3. In this Rule, the required reporting limits are based on the capabilities of the analytical methods, which, as noted earlier, continue to become more sensitive.
There are seven analytical methods in UCMR3 (Table 1), and six of those seven have reporting limits that are in the sub ppb range, with hormones being measured at sub ppt levels. These very low reporting levels will likely result in significant increases in detection frequency for many of the analytes, which in turn will increase public awareness of drinking water quality.
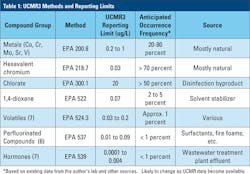
Although it is likely that there will be few detections above current Health Reference Levels, we anticipate that based on the hexavalent chromium and the PPCP experience, the high frequency of detection will heighten public concern about drinking water quality.
The compounds included in UCMR3 represent both naturally occurring contaminants (most of the metals) and a number of anthropogenic compounds (chlorate, 1,4-dioxane, hormones, perfluorinated compounds). It will be critical for utilities to be proactive in crafting communication on these occurrences so that the public maintains confidence in drinking water quality.
Detection of some of the organics (e.g. 1,4-dioxane or the perfluorinated compounds) will almost certainly lead to an interest in increasing the level of water treatment and may also lead to greater demand for point-of-use treatment or bottled water. We should have a much better picture of the impact of the low UCMR3 reporting limits on public perception by late 2013, when results of the first quarter of UCMR3 monitoring become widely available.