As part of the Safe Drinking Water Act Amendments of 1996, the U.S. Environmental Protection Agency (EPA) is required to create a list every five years of up to 30 unregulated contaminants to be monitored in public water supplies. This list is supposed to be derived from the Candidate Contaminant List (CCL) and to represent compounds for which the EPA is in need of occurrence data to determine whether future regulation is warranted. The first Unregulated Contaminant Monitoring Rule (UCMR1) occurred from 2001-2005, the second (UCMR2) from 2008-2010 and we have just embarked on the third round (UCMR3).
Lessons learned and moving forward
In Jan. 2013, monitoring of more than 5,000 public drinking water supplies began for 28 contaminants representing seven different analytical methods. For both UCMR1 and UCMR2 the reporting limits (MRLs) were based on a combination of analytical method capabilities and the available health reference data, with most reporting limits being in the 1 to 10 ppb range. UCMR1 monitoring resulted in a large number of “non-detects.” Perchlorate was detected at ppb levels in nearly five percent of systems, so it is a candidate for regulation in drinking water.
UCMR2 monitoring was similar to UCMR1 with most compounds being non-detects, with the exception of N-nitrosodimethylamine (NDMA), a disinfection byproduct found at parts per trillion levels in nearly 25 percent of systems and metolachlor-ESA, a pesticide, found in less than one percent of systems. Most of the other compounds in UCMR1 and UCMR2 had fewer than three detections nationwide out of more than 30,000 samples.
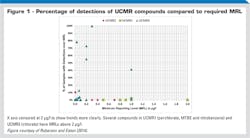
For UCMR3, the EPA changed the paradigm of monitoring and set reporting limits (MRLs) based on the capabilities of the analytical methods. This was at least in part due to the preponderance of non-detects in UCMR1 and UCMR2. This has led to much lower reporting limits in UCMR3, some as low as sub-part per trillion, with a resulting (see Figure1) much greater frequency of detection (Roberson and Eaton, 2014).
In November 2013, the EPA publicly released the first set of results of part of the first year of monitoring (U.S. EPA, 2013), representing nearly 1,000 water systems (up to 6,000 samples). In reporting the results, the EPA focused on “reference levels,” similar to the Health Reference Levels (HRLs) published by the EPA when they first evaluate contaminants for potential regulation and compared the results to those levels rather than on the actual detection frequency. However, these results are eye-opening and will represent a significant communications challenge for public water supplies when they have to report their UCMR3 results with their 2014 Consumer Confidence Reports (CCR). In the CCR one reports the actual detects and not the comparison to HRLs or other reference levels, although it is important to put detections into perspective as to relevance and potential health risk.
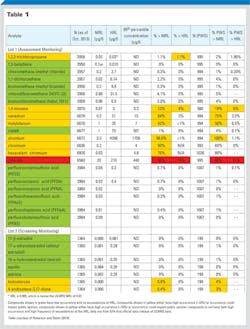
Table 1 summarizes the results as a percent of systems with hits and the percent above the reference level, and also looks at the overall frequency of detection. Several things stand out in looking at this data. First, not surprisingly, the reduction in MRLs results in increased detection. For some of the metals (strontium), more than 99 percent of systems have detections, although less than one percent are above the reference level. Hexavalent chromium, made famous by Erin Brockovich, and an element that now has a proposed California Maximum Contaminant Level (MCL) of 10 ppb and a current EPA MCL of 100 ppb which assumes potentially 100 percent hexavalent chromium, is being detected in nearly 90 percent of systems, but again, less than one percent are above the California proposed MCL.
Other metals, notably chromium, molybdenum and vanadium are all detected in more than 40 percent of systems, with vanadium as high as 75 percent. For all of these elements, groundwater sources have higher levels than surface waters. These elements are mainly naturally occurring, but will still likely be issues of concern for consumers who may well ask, “Why would EPA require monitoring if these are not dangerous?”
The inorganic that is more problematic is chlorate, a disinfection byproduct formed either from degradation of sodium hypochlorite, on-site generation of hypochlorite or chlorine dioxide. Chlorate is being detected in more than 68 percent of systems, with nearly 31 percent of systems exceeding the EPA’s reference level of 210 ppb. However, this HRL results from EPA’s across the board use of a relative source contribution of 20 percent for the HRL, whereas a more likely relative source contribution for chlorate would be in the 60 to 80 percent range because disinfected drinking water is the largest exposure source. That would make a potential standard in the 600 to 800 ppb range. If the EPA elects to regulate chlorate near 210 ppb, water supplies will have a difficult time with treatment once chlorate is formed because there are few effective removal techniques for chlorate. Chlorate formation can be controlled by proper storage of hypochlorite, but that does not address the on-site generation formation or the chlorine dioxide formation. It is notable that the World Health Organization (WHO) has a limit of 700 ppb, assuming 80 percent relative source contribution, more than three times EPA’s reference level. Canada’s guideline value is 1 mg/L, also assuming 80 percent relative source contribution from drinking water. At this point, it is hard to predict where EPA may choose to regulate chlorate.
Overview of monitored organics
Moving to the organics being monitored in UCMR3, there are four classes: Volatiles, perfluorinated compounds (PFCs), such as PFOS and PFOA, hormones and 1,4-dioxane. Most of the volatiles are being found in very few systems (less than five percent), but still substantially more frequently than the organics in UCMR1 and UCMR2, again likely due to the low MRLs.
Notable, however, is the fact that 1,3-butadiene, considered the most toxic of the volatiles, has not been detected in a single system to date. PFCs are being found in less than one percent of systems, with no values approaching the reference levels. Other work by the EPA with the U.S. Geological Survey (USGS) has shown much greater frequency of PFCs in water systems, but at levels even lower than the UCMR3 MRLs, again demonstrating that the lower one looks for things, the more one sees.
Hormones have the lowest MRLs in the UCMR3, but there have been few hits (less than five percent of systems). However, given the interest in “drugs in the water” those systems that do have detects will again have a challenge in explaining the results to their consumers. It’s interesting that the hormones being detected most frequently, including testosterone and 4-androstene-3,17-dione, are not on the CCL3 list and thus, have no reference levels.
The last of the organics — 1,4-dioxane — is a great surprise because it is being found in nearly 19 percent of water systems, with more than six percent of samples exceeding the 0.35 ppb reference level. This compound is found in many personal care products (e.g. many shampoos) and is widely used. Like chlorate, 1,4-dioxane is very difficult to remove once it is found, with advanced oxidation being the only effective technique. Although initially expected to be mainly a groundwater supply issue, many of the highest levels have been found in surface water supplies. Thus, the widespread occurrence of 1,4-dioxane in UCMR3 monitoring results could result in a move towards national regulation in drinking water, as many states (over 12 at last count) already have regulatory limits for 1,4-dioxane.
So what does this all mean? First, because in prior UCMRs there have been such high percentages of non-detects or very low detections and low frequencies, whereas in UCMR3 there have been a lot of detects, albeit at very low concentrations, it raises some questions about EPA’s decision logic for selecting chemicals to be analyzed in the UCMRs. Second, it demonstrates that “the lower you look, the more you find” in drinking water and could well cause the EPA to rethink their approach for the next UCMR (UCMR4). Third, there are a few contaminants that are a cause for concern due to their widespread occurrence at levels above "health reference levels," which could well result in a need for additional treatment. Stay tuned for the next public data release in early 2014, which will add to the database and determine whether the trends are continuing.
Sources
Roberson, A. and Eaton, A. 2014. Retrospective Analysis of Mandated National Occurrence Monitoring And Regulatory Decision-Making. Journal of the American Water Works Association, in press.
USEPA, 2013. Occurrence Data: Accessing Unregulated Contaminant Monitoring Data. http://water.epa.gov/lawsregs/rulesregs/sdwa/ucmr/data.cfm#ucmr2013 (accessed December 28, 2013).
Andrew Eaton, PhD BCES is the technical director and vice president of Eurofins Eaton Analytical Inc., the nation’s largest potable water testing lab and a division of Eurofins, the world’s largest food, environmental and pharmaceutical testing company. Dr. Eaton has a PhD from Harvard University in Geochemistry and has been working in the water industry for more than 35 years. He specializes in analytical methods for emerging contaminants.


