Reverse osmosis: Why protecting RO membranes is critical
Key Highlights
- Effective pretreatment, including micro- and ultrafiltration, is vital to remove particulates and protect RO membranes from fouling and chemical damage.
- Monitoring key parameters such as temperature, pressure, flow, and conductivity helps maintain system performance and identify early signs of fouling or scaling.
- Proper chemical dosing, including antiscalants and biocides, prevents mineral scaling and microbiological growth, extending membrane lifespan.
- Regular membrane cleaning using alkaline and acid solutions is necessary to remove organic, inorganic, and biological deposits that cause performance decline.
- Comprehensive raw water analysis and long-term data collection are essential for designing effective treatment systems and ensuring reliable operation.
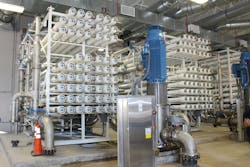
Reverse osmosis (RO) has gained much popularity as the core technology of high-purity makeup systems at power plants and other facilities. RO also serves applications at food and beverage, desalination and medical facilities, and is becoming a key technology for water recovery in zero liquid discharge (ZLD) systems. By its very nature, RO is susceptible to particulate and microbiological fouling, as well as mineral scaling, unless these issues are addressed by proper pre- and in-stream treatment. Poor or inadequate treatment methods can lead to irreversible membrane fouling that is very costly and which may, in serious cases, shut down the plant. This article examines critical RO treatment issues.
Important RO design fundamentals
Most RO elements are of the spiral-wound design in which a flat membrane and spacer sheets are wrapped around a perforated central tube. Purified water, aka permeate, is generated by crossflow filtration, in which pressurized feed water flows parallel to the membrane along the spacer sheets, and the induced pressure forces water, minus 99-plus percent of the dissolved solids, through the membrane.
The permeate spirals to the perforated central tube, while the concentrate — aka reject — flows to the next element.
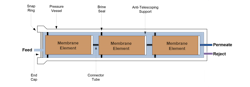
The number of membranes per vessel (commonly four, five or six) and number of vessels are calculated from such variables as required throughput, feed water quality, operating temperature range and others.
A basic RO configuration is shown below.

For normal surface and ground waters, each stage will produce approximately 50% permeate and 50% reject. Thus, the overall conversion rate of a standard two-stage RO is 75%. Only half the elements are needed in the second stage due to the reduction in feed water flow.
For high-purity applications such as makeup to utility boilers, two-pass RO is common, where the second pass treats the permeate from the first pass. The final step is permeate polishing by either mixed-bed ion exchange or continuous electrodeionization (CEDI).
With this background information in place, let’s examine feed water issues and chemistry control methods that most impact RO performance and membrane integrity.
Bad actors and their control
Raw makeup water, even if it comes from a seemingly pristine surface supply, still contains suspended and dissolved solids, which, without removal or conditioning, can cause problems in the facility’s water systems. A top priority for RO protection is particulate removal. The tight fit between membranes and spacers offers an ideal location for particles to accumulate, especially in the lead elements. Virtually every RO unit is equipped with a set of cartridge filters (5-25 µm, nominal pore size1) immediately upstream of the feed pump. The cartridge filters capture fine particles, but they do not have the capacity to serve as stand-alone filters. We will shortly examine primary filtration techniques after answering two questions, “What are the guidelines for acceptable particulate concentrations in RO feed? And how are they monitored?”
The analytical procedure for precisely determining the total suspended solids (TSS) concentration in a sample is to filter a known volume of water, usually one liter, through a pre-weighed fine mesh filter paper, dry the paper in an oven at a temperature slightly above 100°C, and then weigh the paper after drying. Obviously, this procedure is somewhat time-consuming. A common surrogate, of which on-line instruments have long been available, is turbidity; the measurement of the light scattering properties of suspended solids. (We will see a practical example shortly.) Because particles of different sizes, shapes and reflectivity influence turbidity readings, an absolute correlation to TSS is not possible.
The measurement that has become standard in the RO industry for evaluating suspended solids concentration and membrane fouling potential is the silt density index (SDI). SDI is a spot test, where a flowing sample is passed through a 0.45-µm filter at 30 psig pressure. Measurements are made for 500 milliliters (mL) of water to pass through the filter at the beginning of the test (ti) and again after 15 minutes (tf).
The SDI is calculated as follows (Equation 1):
SDI15 = (1-(ti/tf))/T * 100
As an example, consider the following data taken by the author during a test several years ago:
ti = 34 seconds (s)
tf = 66 s
T = 15 minutes (min)
Per Equation 1, the SDI15 = 3.2
A general rule of thumb is that SDI should be below 5 and preferably at 3 or below to protect RO membranes, with multiple analyses collected over time to evaluate potential water quality fluctuations.
A point to note is that none of these analytical techniques provide direct data on particle size. Size analyses and distribution can sometimes be important when selecting filtration methods for water streams.
Clarification/media filtration is a longtime and proven method for removing particulates from raw water streams. The mindset some people have of clarifiers is of the large, circular units at potable water and wastewater treatment plants. Industrial clarifier technology has advanced significantly over the last few decades, with many configurations (often of rectangular design) incorporating inclined plates to enhance solids settling.

Whereas a typical rise rate from circular clarifiers might be in the vicinity of 1 gallon-per-minute per square foot of clarifier surface area (gpm/ft2), much higher rates of 5 to 25 gpm/ft2 are possible in modern units. These have a much smaller footprint than conventional clarifiers.
A very important issue for those makeup systems that have clarifiers upfront is that some coagulants and flocculants, if overdosed, can foul RO membranes. Aluminum salts are particularly notorious. The positive electrostatic charge on the carryover products can irreversibly bind with membranes, which carry a slight negative charge.
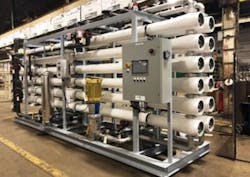
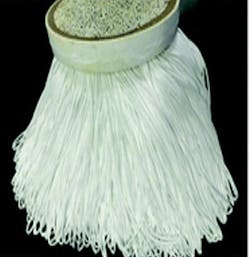
A major development over the last two decades is the maturation of micro- and ultrafiltration (MF and UF, respectively) for pretreatment particulate removal. A compact ultrafilter unit with ten parallel pressure vessels (five are on the far side of the unit) is shown below.
Each pressure vessel is filled with thousands of spaghetti-like hollow fiber membranes (shown below).
The chart below shows the filtration ranges of the common technologies.
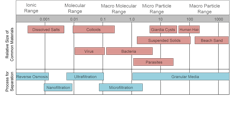
Because MF and UF only remove particulates, feed pressures are much lower than for reverse osmosis.
In the mid-2000s, the author served as lead on a project to replace an aging clarifier at a large facility with a microfiltration unit. The clarifier/filter effluent turbidity typically ranged between 0.3-1.0 nephelometric turbidity units (NTU). This equated to around three-week intervals between needed changeouts of the RO cartridge filters. Upon MF startup, effluent turbidity levels dropped to a range of 0.027 to 0.036 NTU. The cartridge filter replacement interval increased from three weeks to three months, another indicator of much improved pretreatment particulate removal.
Another important pretreatment issue is protecting RO membranes from oxidizing biocides, and in particular, chlorine. The material for most membranes is polyamide-based, a compound that contains nitrogen in the molecular structure. Chlorine bonds with nitrogen atoms and degrades the material. A general rule of thumb is 1,000 ppm-hours, which says that a 1 part-per-million chlorine concentration will destroy an RO membrane in 1,000 hours. Correspondingly, a 10-ppm chlorine concentration would destroy the membrane in 100 hours. The point is that chlorine must be removed ahead of the RO unit. We will return to this issue shortly.
The next section looks at important instrumentation and data collection to maintain reliable operation.
RO system monitoring and chemical feed discussion
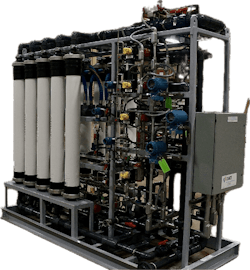
RO units require conscientious monitoring. The figure below illustrates recommended online instrumentation for a system.
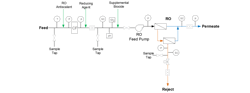
Space limitations prevent an in-depth discussion of every instrument shown in the figure, but listed below are several important details:
- Temperature (T), pressure (P), flow and specific conductivity (SC) are all critical for RO performance monitoring. Membrane channels shrink and expand with changing water temperatures, which can mask performance decline due to fouling and scaling. These physical measurements are primary inputs to a “normalization” computer program that can track RO performance over time, accounting for temperature influences. A rule-of-thumb guideline calls for membrane cleaning when normalized performance drops by 10% or so from baseline.
- Differential pressure across the cartridge filters (CF) is the primary indicator of filter performance and the timing of filter change outs.
- A sudden increase in permeate specific conductivity suggests a mechanical failure in one of the RO pressure vessels. Some RO units are equipped with a grab sample port on each pressure vessel permeate line. If the permeate SC monitor indicates a problem, the operator can sample each pressure vessel with a handheld conductivity meter and narrow the search to a particular pressure vessel.
- While the RO is in operation, the reject stream valve should never be completely closed, and if that should happen an automatic alarm from the flowmeter will alert operators to a no flow condition.
- The grab sample taps before and after the cartridge filters are the primary locations for SDI testing. As this author can directly attest, the taps are beneficial for other tests. In one case, I performed grab sample iron analyses to verify that a pre-treatment system to remove dissolved iron from a well water supply was performing properly.
- The instrument list includes an online chlorine monitor. Common is reducing agent feed, e.g., liquid sodium bisulfite (NaHSO3) to remove the oxidizer, with an instantaneous alarm from the chlorine monitor if the reducing agent feed system malfunctions. An alternative or supplemental measurement is oxidation-reduction potential (ORP).
Regarding the final bullet point, it is well known that some microbes will go into hibernation when they sense an oxidizing biocide and then re-emerge once the biocide has been removed. Severe RO membrane fouling may result. The schematic above includes a feed point for a supplemental, non-oxidizing biocide. The author was directly involved in several projects of this type. In one application, we controlled microbiological fouling with feed of a non-oxidizer for one hour every two days. Alternatively, specialty or mild oxidizers such as in-situ generated monochloramine (NH2Cl) have been developed that inhibit microbial growth but do not attack membranes. Furthermore, improvements to ultraviolet (UV) light generators are making that technology more mainstream for microbial control.2
Notice also in the schematic above the antiscalant chemical feed. In even the basic RO configuration shown earlier in the article, the dissolved solids concentration in the trailing elements of the final stage increases four-fold over raw water levels. Typically, calcium carbonate (CaCO3) is the first mineral to precipitate from solution, but other potential deposits include calcium sulfate (CaSO4), silica (SiO2) and silicates. At times, added to this list, can be barium sulfate (BaSO4), strontium sulfate (SrSO4), calcium fluoride (CaF2) and calcium phosphate (Ca3(PO4)2). A comprehensive normalization program will determine the scaling potential of many compounds. From this data effective antiscalant(s) and dosages can be calculated. Modern control systems allow data to be displayed in real time, which can give operators and technical personnel a heads-up on system performance and upset conditions.
Note: With good pretreatment and scale control chemistry, membranes should have a lifetime of 3 to 7 years, possibly longer, with the understanding that regular raw water sampling and analyses need to be initiated at project inception to accurately evaluate raw water chemistry and how it may change during short-term events or from seasonal influences. Regarding the former, heavy rainfall may stir up suspended solids in surface water sources that can overwhelm MF or UF membranes. Long-term data is very important for zeroing in on potential scale-forming chemistry and for selecting chemical formulations that minimize deposition. Cases are known where a makeup system had to be replaced shortly after startup because of inaccurate or insufficient raw water analyses that led to incorrect design.
RO cleaning
Even with well-designed pre- and internal treatment equipment and chemistry programs, RO membranes accumulate suspended and dissolved solids. The differential pressure alone gradually traps solids on the membrane surface. If not removed, the solids will eventually cause irreversible fouling. Accordingly, periodic off-line cleanings are necessary to restore membrane conditions to near baseline. Recommended guidelines to initiate a cleaning are:1
- Loss of 10 to 15% in normalized permeate flow
- Increase of 10 to 15% in normalized differential pressure
- Decrease of 1 to 2% in salt rejection
Because fouling occurs on the concentrate side of the membranes, cleaning solutions are delivered through the reject piping. Piping and connections should be plumbed such that each stage can be cleaned individually. The figure below illustrates the basic schematic of a cleaning skid.

RO permeate is a requirement for cleaning solution makeup. Via the recycle line and tank heater, the solution is brought to an appropriate temperature range; 95-105°F is common. The operators can then valve in the circulation loop to and from each stage. A standard component of the circuit is a cartridge filter, as the cleaning process releases impurities that need to be captured.
With the aid of feed water chemistry and operating data, a reputable RO equipment or membrane supplier should be able to recommend or provide formulations for optimal cleaning. As noted earlier, first stage membranes accumulate particulates, while scaling is more common in the second stage. Organic and microbiological fouling may occur in both stages. Therefore, a multi-step cleaning process, with appropriate rinse steps, per stage may be needed. An alkaline procedure dislodges organic and microbiological deposits. Besides the alkaline agent, these solutions often include a surfactant and a chelating compound (usually ethylenediaminetetraacetic acid (EDTA)). EDTA can help to dissolve some inorganic compounds such as calcium sulfate that are resistant to acid.
The acid procedure utilizes a relatively low-pH solution to remove inorganic deposits, including calcium carbonate and iron oxides. A common core chemical in these solutions is citric acid, whose chelating property towards iron is arguably stronger than the acidic reaction. Reference 1 provides additional information about membrane cleaning.
Conclusion
RO has become very popular as the core demineralization process for many applications. Key takeaways from this article are:
- Project developers should begin collecting comprehensive raw water quality data at project inception to accurately evaluate the conditions the makeup system will see.
- Proper pre-treatment is critical to protect RO systems.
- Particulate accumulation, scaling, and microbiological fouling in membranes are all possible and problematic.
- Conscientious monitoring, with the aid of normalization software, and periodic membrane cleaning are necessary for unit reliability.
Disclaimer
This article offers general information and should not serve as a design specification. Every project has unique aspects that must be individually evaluated by experts from reputable water treatment and equipment firms. Also, any issues that could potentially have an environmental influence, for example, wastewater discharge from a proposed makeup, process or cooling water treatment system, must be presented to and approved by the proper environmental regulators during the project design phase.
References
1. W. Byrne, Reverse Osmosis: A Practical Guide for Industrial Users, Tall Oaks Publishing, Littleton, Colorado, 2002.
2. Personal conversations with Dennis Bitter of Atlantium Technologies.
About the Author

Brad Buecker
Brad Buecker currently serves as Senior Technical Consultant with SAMCO Technologies. He is also the owner of Buecker & Associates, LLC, which provides independent technical writing/marketing services. Buecker has many years of experience in or supporting the power industry, much of it in steam generation chemistry, water treatment, air quality control and results engineering positions with City Water, Light & Power (Springfield, Illinois) and Kansas City Power & Light Company's (now Evergy) La Cygne, Kansas, station. Additionally, his background includes 11 years with two engineering firms, Burns & McDonnell and Kiewit, and he spent two years as acting water/wastewater supervisor at a chemical plant. Buecker has a B.S. in chemistry from Iowa State University with additional course work in fluid mechanics, energy and materials balances, and advanced inorganic chemistry. He has authored or co-authored over 300 articles for various technical trade magazines, and he has written three books on power plant chemistry and air pollution control. He is a member of the ACS, AIChE, AIST, ASME, AWT, CTI, and he is active with Power-Gen International, the Electric Utility & Cogeneration Chemistry Workshop, and the International Water Conference. He can be reached at [email protected] and [email protected].