Limits page is key to discharge permit compliance

Complying with a discharge permit requires careful examination of its limits page.
The process begins by analyzing the entire permit. In this process, recognize that the issuer of the permit will either be the U.S. Environmental Protection Agency (EPA), state environmental department or the receiving sewer authority. If the discharge permit is issued by the EPA or the state environmental department, the discharge is regulated under the National Pollutant Discharge Elimination System (NPDES). If the discharge is issued by the local sewer authority, that authority receives the discharge and treats it to release into environmental surface waters. All permit limits are pre-approved by local state environmental department.
Also, pay attention to the permit issuer, discharger, issue date and expiration date. Identify important sections of the permit including effluent characteristics, discharge limitations and monitoring requirements, responsibilities for reporting, monitoring results, and special requirements. If the industry is categorized under the 40 Congressional Federal Register (CFR), it will be noted along with the required parameters to be analyzed.
Start with the effluent limits and monitoring requirements page, which I call the limits page. The discharge permit limits are detailed with parameter, discharge limitations, monitoring frequency and sample type. Examine the most frequent timeframe for monitoring, which could be anywhere from three consecutive days a month to semi-annual. Most often, monitoring requirements for each parameter are monthly.
The discharging industry must comply with all monitoring frequencies. Collecting the appropriate sample type, grab or 24-hour composite, is also required.
Common parameters for analysis include biochemical oxygen demand (BOD), total suspended solids (TSS), and oil and grease (O&G).
Additionally, satisfying discharge permit limits is critical to achieving permit compliance. These are listed by monthly average, daily maximum or both expressed in concentrations milligrams per liter (mg/L) or mass pounds (lbs./day) or both.
The industry must also comply with reporting requirements. This can vary from reporting during the month of sampling to 20 days into the next month.
Parameter details
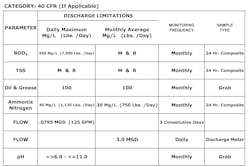
Figure 1. An example of an industry discharge permit limit page
With this understanding of the permit limits page in mind, let’s look at specific parameters in the order they are listed in Figure 1.
- BOD. The discharge limit is the daily maximum expressed in mg/L and lbs./day. The monthly average is monitor and report (M&R). The monitoring frequency is monthly, and the sample type is 24 hours. Keep in mind that the limit is expressed as daily maximum, which means permit compliance must be satisfied in a single sample event.
- TSS. The limits are expressed as M&R, which means samples must be collected, analyzed and reported. No limits are required for compliance.
- O&G. This has the same numeric limit as mg/L for daily maximum and monthly average. When the numeric limit is the same for daily maximum and monthly average, permit compliance must be satisfied in a single sample event.
- Ammonia nitrogen. This has different numeric limits such as mg/L and lbs./day for both daily maximum and
monthly average. - Flow (first entry). The discharge limit is daily maximum expressed in millions of gallons per day (mgd) and gallons per minute (gpm). The monitoring frequency is three consecutive days. Flow as gpm and mgd must always be satisfied.
- Flow (second entry). The discharge limit is monthly average expressed in mgd. When the numeric daily flow limit is monthly average, the result is the effluent discharge for the month divided by the number of days in the month.
- pH. This ranges between 6.0 and 11.0.
Numbers variance by scenario
Compliance with ammonia nitrogen (No. 4) varies according to different scenarios. Let’s examine a couple.
Scenario 1
During a 24-hour sample event, discharge flow was 3.125 mdg, and the lab result was 25 mg/L. The calculated lbs./day is 652 = 3.125 X 25 X 8.34.
This scenario is compliant with 25 mg/L below with a monthly average of 30 and daily maximum of 40, and 652 lbs./day is below both monthly average of 750 and daily maximum
of 1,125.
Scenario 2
During the first 24-hour sample event, discharge flow was 3.125 mgd, and the lab result was 35 mg/L. The calculated lbs./day is 912 = 3.125 X 35 X 8.34.
This scenario is compliant and below daily maximum with 35 mg/L below 40 and 912 lbs./day below 1,125. However, it would be in violation/above monthly average with 35 mg/L above 30 and 912 lbs./day above 750.
Complying with daily maximum and violating monthly average allows the discharger to collect another sample within monitoring frequency to be used to lower the monthly average.
During the additional/second 24-hour sample event, discharge flow was 3.125 mgd, and the lab result was 22 mg/L. The calculated lbs./day is 573 = 3.125 X 22 X 8.34. The compliant average mg/L is 29 = (35 + 22) ÷ 2, and the compliant average lbs./day is 743 = (912 + 573) ÷ 2.
This scenario is compliant with 29 mg/L below both monthly average of 30 and daily maximum of 40 and 743 lbs./day below both monthly average of 750 and daily maximum of 1,125.
Compliance also requires every sample result to be below daily maximum.
Scenario 3
During a 24-hour sample event, discharge flow was 3.125 mgd, and the lab result was 70 mg/L. The calculated lbs./day is 1,824 = 3.125 X 70 X 8.34.
This scenario is in violation with 70 mg/L above both monthly average of 30 and daily maximum of 40, and 1,824 lbs./day is above both monthly average of 750 and daily maximum of 1,125.
An additional sample can be used in this scenario to achieve compliant monthly average. However, the additional sample cannot be used to avoid violation with daily maximum.
Results
As these scenarios show, discharge permit compliance requires paying close attention, similar to other record retention requirements outlined in previous editions of this column.
If you have specific troubleshooting concerns or other wastewater queries, contact the author.
Known in the industry as "Wastewater Dan," Dan Theobold, proprietor of Environmental Services, is a professional wastewater and safety consultant/trainer with more than 24 years of industry experience