Elution Studies Diagnose Demineralizer Regeneration System Problems
By James R. Holland Jr.
The pretreatment of boiler feed water requires removal of both suspended solids and dissolved solids. The ionic species dissolved in water lead to corrosion and deposition in modern high-temperature, high-pressure boilers. Their removal is necessary to prevent boiler tube failures.
Ion exchange demineralization provides a high quality boiler feed-water, removing ionic species from dilute aqueous solution by employing combinations of anion and cation exchange resins. The anion exchange resin is used in the hydroxide form and the cation exchange resin is used in the hydrogen form.
During the service cycle, ions are absorbed by the resin, or more appropriately, exchanged for hydrogen and hydroxide ions. During the regeneration cycle these absorbed ions are desorbed, or eluted by using a regenerant such as sulfuric acid for the cation resin, and sodium hydroxide for the anion resin.
Regeneration is a critical part of the absorption-desorbtion cycle. Improper regeneration of the resins can result in short service cycles or ionic species leaking into the boiler feed-water system.
If an ion exchange demineralizer exhibits throughput capacity loss or fails to produce the desired quality; the following is checked first.
1) Run a complete analysis of the water supplying the Demineralizer.
2) Determine if each ion exchange vessel contains the proper amount of resin.
3)Verify regenerant levels; time, concentration and flow rate.
If there has been no significant change in the chemistry of the water supplying the demineralizer, no resin lost from the system, and regenerant levels are within limits, a regeneration elution study can be conducted to identify problems with the system. Regeneration elution studies involve the collection of samples at the outlet of the ion exchange vessels. Regenerant and ion concentrations are determined and graphed. The size and shape of these curves are used in the analysis of the system.
Regenerant Elution Curves
During the desorbtion or elution step of demineralizer regeneration, a concentrated solution is introduced to the ion exchange resin. When the resin is operating in the hydrogen/hydroxide form, these solutions are usually sulfuric acid and sodium hydroxide. The amount of regenerant used by the resin is determined by sampling the effluent of the resin bed during both regenerant introduction and displacement steps. The percent regenerant by weight is determined in each sample either by wet chemistry or instrumental techniques. The percent regenerant by weight leaving the resin bed is plotted versus time and the regenerant elution curve is developed.
Regeneration efficiency should in the 40-60% range. Efficiencies greater than 60% usually indicate that ionic species have not fully eluted the bed. Efficiencies less than 40% usually mean that an excess of regenerant is being used or the resin is kinetically impaired. The shape of the regenerant elution curve is also important.
When collecting elution data during the regeneration cycle, it is possible to determine the performance of the ion exchange resin, regeneration efficiency, and the elution characteristics of the ionic species that were removed in the service cycle.
To automate this process, staff at American Electric Power (AEP) designed portable analyzers that measure and trend the regenerant concentration at the effluent of each ion exchange bed. These consist of wide range conductivity analyzers and conductivity cells mounted in carrying cases. The conductivity analyzers have been programmed with algorithms that convert conductivity to percent by weight regenerant (one is programmed for sulfuric acid and the other is programmed for sodium hydroxide).
The analyzers have 4-20 mA output connected to a battery powered data logger. The data loggers are downloaded to a PC and the elution curves are drawn automatically in a spreadsheet program using Simpson's Rule to calculate the area under the elution curve.
Ion Elution Curves
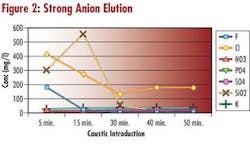
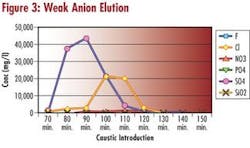
During the desorbtion or elution step of demineralizer regeneration, samples of the eluate are collected. Theses samples are analyzed in the laboratory for the concentration of the ionic species present. The anions: chloride, fluoride, nitrate, phosphate, sulfate and silica are determined using ion chromatography. The cations: sodium, ammonia, potassium, magnesium, calcium, copper and iron are determined with ICP spectroscopy.
Analysis is also run on a sample of the concentrated regenerant to provide baseline concentrations.
The concentration of the ionic species eluting the resin bed is plotted. This is compared to the regenerant elution curve so that regenerant introduction times can be optimized, allowing maximum ion elution while using minimum regenerant.
One additional parameter is checked on the eluate from anion exchange resins. It is important to insure that TOC (total organic carbon) has eluted the bed during the desorbtion or regenerant introduction step.
Application of Elution Studies
Regeneration elution studies can optimize resin regeneration by insuring all ions are eluted and unnecessary amounts of costly regeneration chemicals are not being used.
Observing the size and shape of both the regenerant and ion elution curves can also identify mechanical problems. Poor distribution of regenerant in the bed due to plugged laterals or poor backwash is easily identified. Looking at regeneration efficiency can identify resin problems. Efficiency drops when anion resin becomes fouled or cation resin becomes oxidized. Looking at the ion elution curves can identify incomplete regeneration.
About the Author:
James R. Holland Jr. is the Steam Process Owner at Cardinal Plant. American Electric Power, an investor-owned utility, and Buckeye Power Co., a member-owned organization of rural electric cooperatives, jointly own Cardinal Plant. The plant encompasses three separate coal fired steam-generating units located on a 500-acre site along the Ohio River near Brilliant, OH. Holland has more than 26 years experience with AEP in engineering and energy production. This article was adapted from a paper he was to present at the 2003 Industrial Water Conference in Las Vegas, NV.


