Filter Operation Enhancement with ClO2
By Daniel Hammond, P.E., and Greg D. Simpson, Ph.D.
Side-stream filtration offers many benefits in cooling tower operation. In a recent report -“Cooling Tower Side-stream Filtration 101,” published in CTI Journal in 2004 - a number of benefits of use of side-stream filtration were described. These benefits included a reduction in turbidity which resulted in a substantial increase in cycles in one plant. This increase in cycles translated to significant reductions in cooling water chemical treatment costs, energy costs, and water costs.
While benefits of side-stream filtration are documented, so to are their limitations. These are less a limitation of the side-stream filtration equipment or technology, however, than of the ability of conventional oxidants to control fouling from microbiological growth that limits effectiveness of side-stream filtration equipment. Microbiological growth in filter media attaches to and binds the media together, reducing effectiveness of the backwashing cycle at removing the fouling material. With the increase in microbiological loading on such a filter and the documented inability of conventional oxidants such as chlorine or bromine to penetrate the biofilm, the filter becomes a site of reinoculation where bacteria can be rapidly reintroduced into the cooling system. These limitations have resulted in a number of side-stream filters being taken out of service.
In a recent field evaluation on a small pilot unit in a potable water facility, an investigation was done to measure particle counts of specific sizes in filtered water effluent, as some known pathogens found in potable water are of a size that can be measured by particle counting, but their size is too small to influence turbidity. One surprising result was the impact small amounts of chlorine dioxide (ClO2) had on the differential pressure of the filter. These results, and their interpretation as they relate to cooling tower side-stream filter operation, are discussed. And while the data was obtained in a potable water facility, the results are easily translatable to side-stream filters in industrial plants.
Experimental
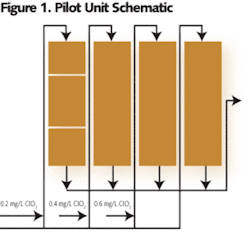
Figure 1 shows a schematic of the pilot unit. In the pilot unit, four filters are in parallel. Each filter has 36" of bituminous based GAC which lies atop a 12" layer of sand. The system is equipped so each filter can be dosed separately. Raw water feed to the potable water facility is treated with chlorine to control bacteriology, but the chlorine feed rate is controlled so that no free chlorine reaches the GAC filters.
Chlorine dioxide was prepared by a method described in other work and was dosed at about 0.2, 0.4, and 0.6 mg/L to Filters 1-3, respectively. The ClO2 dosages varied only slightly (± 0.1 mg/L) during the test. No other chemicals were added during the test.
The general protocol followed was to treat the first three filters of the pilot unit over about a week period of time. At the end of the week, feed of ClO2 was stopped and the unit was shut down for the weekend. Backwashing each filter was done at the beginning of each week, at which time feed of ClO2 is continued. For the untreated filter, the water going to this filter was well disinfected with ClO2 being added at the raw water line near the demand of water, so there was basically no ClO2 present in the water going to the untreated filter. Because the water was well disinfected, a minimal number of bacteria survived to see the untreated filter. The test lasted for about six weeks.
Results
The raw differential pressure data for Filter 2 (~0.4mg/L ClO2) and the untreated filter are shown in Figures 2 and 3, respectively. Clearly, the differential pressure increases over the duration of the trial for the control filter (see Figure 3) at a much more rapid rate than for a typical filter treated with ClO2 (see Figure 2). To illustrate this, Figure 4 shows a comparison of differential pressure data obtained during the test’s sixth week. This data shows that the differential pressure of the untreated filter increases at a higher rate than those treated with ClO2. Surprisingly, there doesn’t appear to be much difference between the filter treated with ~0.2 mg/L ClO2 and the one treated with ~ 0.6 mg/L ClO2. This raises the question as to how low ClO2 can be dosed and the lower rate of increase in differential pressure be maintained.
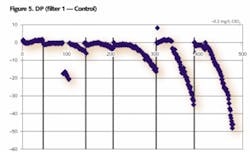
By plotting the difference between the DP of a treated filter and the untreated filter, the data show a cumulative effect. Figure 5 shows the plot of this ΔDP for Filter 1, which received the lowest applied [ClO2].
The data show that during the first partial week of treatment, there was very little difference between the rate of change of the differential pressure of Filter 1 vs. that of the control filter.
During Week 2, except for what is considered some spurious data during the middle of the week, the data begins to tail downward toward the end of the week, indicating a lower differential pressure of Filter 1 vs. that of the control.
During the third week, again there’s little difference between Filter 1 and the control, except that toward the end of the week, the data begin to tail downward slightly, indicating a slightly reduced rate of increase in differential pressure of the ClO2-treated filter vs. that of the control filter.
During the middle of the fourth week, a noticeable change starts to occur. From this point onward, there’s an increasing difference between differential pressure of the ClO2-treated filter and the un-treated filter.
During the fifth week, on about the end of the second day of treatment, there’s a very large deviation from zero. This change indicates an increasing difference between the pressure differential of the ClO2-treated filter and that of the control.
By week six, at the end of the first day or beginning of the second day, the trend continues, with the filter being treated with ClO2 showing a significantly reduced increase in differential pressure over that of the control.
Supporting Field Results
In the Southwest, where the wind blows with some regularity, many side-stream filters in many plants have been taken out of service. In the early to mid-1990s, many of these out-of-service side-stream filters were cleaned and placed back into service by use of ClO2. The process included initiating the backwash procedure and filling the side-stream filter with ClO2 of about 1,000 mg/L and allowing it to sit for an hour or so before resuming the backwashing procedure. In this way the media was rapidly cleaned, allowing the filter to be placed back into service.
In more recent work, the application of ClO2 to a Parkson DualSand Filter in a desalination plant was evaluated. The DualSand filter is a continuous self-cleaning filter where air is bubbled through a small riser in the center of the filter. The air causes the sand to scrub against itself and abrade other sand particles and provide a scrubbing action to remove biological growth. Application of ClO2 resulted in enhanced cleanup of the filter media. In addition, the differential pressure of the replaceable cartridge filter immediately downstream of the sand filter was maintained well below the manufacturer’s upper limit where filter replacement was required. This filter helps to ensure protection of the downstream reverse osmosis unit. During the two week test on a pilot unit, replacement of the cartridge filter was not required, yet in the plant, replacement was being done every three days.
Conclusion
Several conclusions can be made from this work. The most obvious conclusion that can be reached from this data is that ClO2 can provide significant reduction in the rate of microbial fouling of filters. A more significant, yet perhaps less obvious conclusion is that the effect of ClO2 appears to be cumulative. ClO2 can clean up aged biofilm, if sufficient turbulence (e.g., backwashing of filters or even cooling water exchangers) can be done. And although the data shown here is for continuous use of ClO2, even intermittent use has shown considerable improvement, although the effect takes longer. A third conclusion is that the effect appears to be dosage independent over the range tested (0.2-0.6 mg/L). One question that arises is how low the dosage can be reduced and the effect still be observed. The answer is likely to be ‘quite low.’ The reason for this conclusion comes from work on other cooling systems, where ClO2 was applied on an intermittent basis at a rate of 0.01-0.05 mg/L with good results. Chlorine dioxide is a niche oxidant, the use of which was well publicized during the anthrax-contaminated Hart Senate Office Building which was successfully sterilized by gaseous ClO2. Its unusual properties, such as its ready penetration and inactivation of biofilm bacteria, make it an ideal candidate for applications such as side-stream biofouling control. IWW
About the Authors: Daniel Hammond, P.E., worked for the City of Tulsa until his death last spring. Dr. Greg Simpson is a principal with Greg D. Simpson & Associates, a water treatment consultant with a specialty in chlorine dioxide. When this article was written, he was research and development manager for Alitivia Corp. Houston-based Altivia is one of the largest U.S. water treatment chemicals and services providers to municipal potable water and wastewater plants, treating 5 billion gallons of water in over 600 facilities every day. For references on this article, contact Dr. Simpson at [email protected]. Altivia can be reached at 866-258-4842, [email protected] or www.altivia.com.


