Biocide Controls Microbes from Water Towers Beyond Target Levels
Tests of the Engelhard Cooling Water Biocide (ECWB) were carried out in two different cooling towers during spring and summer 2005 at the company’s Elyria, OH, and Attapulgus, GA, plants. Both facilities manufacture process catalysts to enhance how other products - such as thickeners and suspension agents used in making asbestos-free asphalt coatings, ready-mix tape joint compounds, certain kinds of paint, molecular sieves, suspension fertilizers, and oil and gas well drilling fluids - perform.
Microbial contamination in the towers - both suspended planktonic organisms and sessile organisms on tower surfaces - was measured using Biosan SaniCheck BF brand dip slides. Residual chlorine dioxide concentrations were measured using the DPD method via a Hach Pocket Colorimeter II.
Chlorine dioxide (ClO2) is considered one of the most powerful biocides in the industry but, until now, limited to onsite generation. Supplying the power of ClO2 in a convenient tablet, this BIOCIDE changes that. Thus, small-to-medium sized cooling towers can benefit without the usual handling complexities and expense related to gas generation on-site or mixing of liquid chemicals.
Elyria Site Results
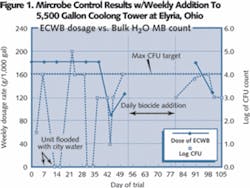
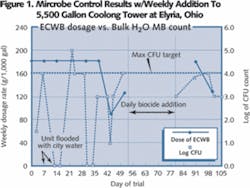
This test was conducted over a 15-week period from April through August 2005 on a 5,500 gallon cooling tower located in a relatively clean, dust-free environment. Water pH was a fairly high 8.5-8.8. The biocide (multiple 8.33 gram tablets contained in a polyester mesh bag) was added to the tower using a 6.3 gallon brominator with 10 gpm of flush water.
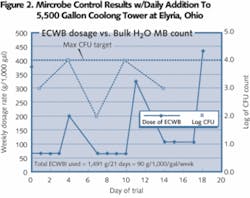
Figure 2 shows bulk water microbe count vs. biocide dose during a period of daily additions. Effective control (< 104 CFU/ml) was achieved on a basis of 90 gm/1,000 gal per week with daily additions, i.e., a 30% dosage reduction vs. weekly additions.
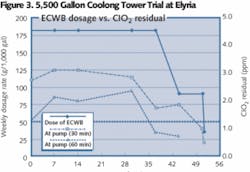
Figure 3 shows ClO2 residual measured at the circulation pump discharge 30 and 60 minutes after weekly biocide dosing. The residual fell as the dose decreased, with the residual after 60 minutes consistently lower than after 30 minutes, i.e., there was a quick loss of ClO2 gas from the system. It also shows - at the effective dose rate of about 130 gm/1,000 gal - the ClO2 residual after 30 minutes was just above the recommended 0.1 ppm per usage instructions.
Finally, corrosion rates were measured using test coupons of copper and mild steel during the period of biocide use. Steel was 0.25 mil per year and copper was 0.09 mil/yr - both excellent values.
Attapulgus Site Results
This trial was conducted over a 20 week period from March through July 2005 on a 5,500 gallon cooling tower in a relatively dusty location with the basin routinely containing a layer of solid sediment several inches thick. Water pH averaged 8.4.
Biocide tablets were added to the unit using 3-gallon brominator with 5 gpm of flush water. Eight weeks of baseline data were collected while the tower was treated with bromine/chlorine briquettes at the dose rate recommended by the water treatment service company. This was followed by another eight weeks of treatment using the biocide and a final four weeks without any biocide addition.
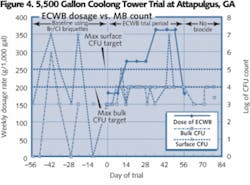
Figure 4 shows surface and bulk water microbial counts as a function of time during the trial. It shows the tower was under fair control during the baseline period, with four of seven surface data points at or above the maximum target of 105 CFU/ml and with one of seven bulk (waterborne) measurements over the maximum target of 104 CFU/ml. Variability of microbe counts was high during this period - attributed to microbial contamination from organisms growing in the sediment layer which it’s believed weren’t well controlled by the standard biocide.
Treatment with the biocide began at day zero with a weekly dose rate of 180 gm/1,000 gal. This was increased to 275 gm/1,000 gal on day 14 and increased again to 360 gm/1,000 gal on day 35. The last dose, on day 56, was reduced to the initial dose of 180 gm/1,000 gal a week. During this time the average microbe counts were similar to the baseline period, but there was less variation with this biocide. Only one surface reading and one bulk reading out of 19 of each were above the maximum target levels. It was interpreted that the improved consistency resulted from better control of organisms in the sediment layer, which reduced severity of microbe release from sediment into the water. All biocide addition was stopped after day 56 and there was no significant change in microbe levels for the final four weeks of the trial.
ClO2 residuals were measured 30 minutes after biocide addition with average levels again, slightly above the recommended 0.1 ppm level. This time, however dose rates averaged about 275 gm/1,000 gal, compared with about 130 gm/1,000 gal in the cleaner Elyria unit. The difference is believed to be due to the sediment layer in the Attapulgus tower and ability of the sediment and associated microbes to react with and consume ClO2.
Conclusion
The Engelhard Cooling Water Biocide was able to control surface and bulk water microbe counts to less than or equal to the maximum target levels of 105 and 104 CFU/ml, respectively, at weekly dose rates between 90 and 275 gm/1,000 gal. Cleaner towers and more frequent, daily addition achieved control at lower dose rates, while dirtier towers and less frequent, weekly addition required higher dose rates.
• Control was achieved with a ClO2 residual of 0.1 ppm or greater (at the pump discharge) 30 minutes after dosing.
• Control levels were at least equal to that achieved using prior commercial biocides used at the recommended dose rates.
Engelhard developed this product as an easy-to-use tablet delivering chlorine dioxide gas for effective control of bacteria, fungi, algae and biofilm growth in cooling tower systems without the hazards or storage and handling mandates of onsite generation.
About the Authors: John Byrne is a research associate and Barry Speronello is a research fellow for Engelhard Corp., an Iselin, NJ-based surface and materials science and Fortune 500 company that develops technologies to improve customers’ products and processes. Contact: Water treatment business development manager Linda Muroski, [email protected].
