Professor POU/POE: Healthy drinking water intake

May 1, 2015

This month’s topic: Daily drinking water requirements and actual water intake.

Q: How much water should people drink, and how much do they actually drink every day?

A: It is complicated. The amount of water that is needed for health and homeostasis varies by a person’s age and weight, climate and his/her level of physical activity. Some estimates and recommendations have been generated from several published studies.

Introduction

The statement, "Water is life," is not an exaggeration. All living plants and animals require regular and sufficient water consumption for survival, as well as for growth and development. Serious and even fatal outcomes can occur under extreme conditions of either seriously inadequate or very excessive water intake, and there might be some health benefits associated with consumption beyond the averages. Water is also a common element in Christian, Muslim and Jewish religious writings.

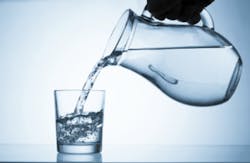
Daily water consumption occurs from several sources: Tap water, beverages and foods made with tap water, bottled water, bottled beverages and metabolic water that is produced from ingested food and its conversion to energy. The first four are obvious. The fifth, metabolic water, is created by living organisms through metabolism by digesting and oxidizing energy-containing substances in their food. Metabolism produces about 110 grams of water per 100 grams of fat, 41.3 grams of water per 100 grams of protein and 55 grams of water per 100 grams of starch. So, it adds a few hundred milliliters to our daily water intake.

How much water should we drink?

Ingested water serves many functions. It is essential for maintaining blood composition, salts balance and cellular osmotic pressure, and it aids digestion, helps eliminate wastes in urine and feces, provides a solvent/solute load for the kidneys and helps control body temperature through perspiration. It usually contains salts and some nutrients like calcium, magnesium, chloride, sulfate, sodium and potassium; and, uptake of essential minerals is often more efficient from water than from foods. Calcium and magnesium uptake from water and milk is in the range of 50 to 60 percent versus approximately 15 to 20 percent from foods.

It is important to consume water regularly, especially during physical stress conditions. I recall when coaches would not allow athletes to consume water during practice and games, ostensibly to prevent vomiting. Nowadays, we see them drinking constantly. Acute dehydration has immediate, measurable and adverse consequences. Fluid loss of one percent stimulates thirst and impairs thermoregulation. Vague discomfort and loss of appetite appears at two percent. Dry mouth appears at about three percent loss. At four percent loss, work capacity decreases by 20 to 30 percent. Headaches and sleepiness occur at about five percent loss. Collapse can occur at about seven percent, and a 10 percent loss is life-threatening.

Water intake is needed at a minimum to replace losses and prevent dehydration. Water is lost through urine, feces, respiration and evaporation. Young children, pregnant and lactating women, the elderly, heavy work and exercisers and persons with certain diseases have increased fluid requirements compared to the general sedentary population. Numerous studies have attempted to determine water needs, but in 1989 the National Research Council (NRC) concluded that because of the complexities, a Recommended Dietary Allowance (RDA) could not be established, but an Adequate Intake (AI) reference value was provided for healthy Canadian and American populations.

Water needs under conditions of physical stress, high temperature and humidity are substantial. Physically active individuals might sweat at the rate of three to four liters per hour under those conditions. Daily fluid requirements have been shown to range from as little as two liters per day to 16 liters per day. Several national military organizations have conducted studies of the water needs of troops under stressed survival and endurance requirements. A study of members of the Zimbabwe National Army doing strenuous work over 12 days showed that consumption of the test group was 11 liters per day versus seven liters per day in the control group.

The U.S. Army revised its water replacement guidelines to 0.5 liters per hour for an easy work rest cycle at 78o to 81.9o F to at least one liter per hour for a hard work/rest cycle of 10/50 minutes at > 90o F. The revision occurred after 190 military personnel were hospitalized over several years for hyponatremia (excess, unreplaced sodium loss by perspiration), which can be fatal when excessively large volumes of plain water were consumed in combination with a low sodium chloride diet.

Gender and age specific AIs were established by the NRC in 2004 (See Table 1).

Table 1

Age AI (l/day)
Zero to six months 0.7 assumed from human milk
Seven to 12 months 0.8 milk plus food and beverages
One to three years 1.3
Three to eight years 1.7
Nine to 13 years 2.4 boys, 2.1 girls
14 to 18 years 3.3 boys, 2.3 girls
19 to 70+ 3.7 men, 2.7 women

The values in Table 1 are applicable under typical, nonstressed conditions. For higher stress situations (e.g., athletes), the amount of water ingested should equal the amount lost, i.e., 1 kg of lost weight = 1 kg of water consumption. Alcohol has a known transient diuretic effect, but adequate fluid intake immediately following alcohol consumption will not result in appreciable fluid losses over a 24-hour period.

The World Health Organization’s (WHO) requirements in liters per day for adults are listed in Table 2.

Table 2


How much water is actually consumed by U.S. citizens?

Regulatory agencies establish regulations for contaminants in water partly based upon assumed values for daily human tap water consumption. Precise determinations of actual consumption vary by individuals and conditions; so to simplify the regulatory decision, the U.S. Environmental Protection Agency (EPA) assumes lifetime consumption of two liters per day for a 70 kg adult, and one liter per day for a 10 kg child. WHO assumes two liters per day for a 60 kg adult and one liter per day for a 10 kg child. Canada assumes 1.5 liter per day for a 70 kg adult.

Several large-scale surveys have produced data on consumption of community water and/or total water by individuals and groups. Results tend to be in similar ranges given the margins of variability in these types of studies (e.g., Kahn; and Kahn and Stralka, 2008). For example, a 1989 report by Ershow and Cantor, using survey data for three consecutive days from 1977-78, concluded that the mean value for tap water consumption was 1.193 liters per person per day, and 88 percent consumed two liters per day or less. A more recent analysis of a survey for two, nonconsecutive days from 1994-96 (EPA, 2000) of 15,303 persons gave 0.927 liters per person per day as the average per capita ingestion of tap water. The estimated 90th percentile consumption was 2.016 liters per day (range 1.991 to 2.047). Some people reported drinking no tap water, so results for 14,012 "consumers only" were 1.0 liters per day (0.976 to 1.024) as the mean, and the 90th percentile value was 2.069 liters per day.

Values for "total water consumption" for "consumers only" were 1.241 liters per day (1.208 to 1.274) as the mean, and the estimated 90th and 95th percentiles were 2.345 and 2.922 liters per day, respectively. So, 83 percent of consumers only consumed two liters of water per day or less.

The average reported consumption for bottled water drinkers was 0.737 liters per day; the 90th and 95th percentile estimates were 1.568 liters per day and 1.971 liters per day.

The total water consumption average for all individuals was 1.232 liters per day, and the 90th and 95th percentiles were 2.341 and 2.908 liters per day. In this study, approximately 84 percent of the U.S. population consumed two liters or less per day. About 13 percent of the U.S. population water consumption in those studies was attributable to bottled water and 10 percent to other sources.

For children between one and 10 years old, the mean total water consumption was 0.528 liters per day, and the 90th and 95th values for total ingestion were 1.001 and 1.242 liters per day. Thus, 90 percent of children consume one liter of water per day or less.

Are there health benefits from greater water consumption?

Although it is difficult to precisely determine desirable and ideal water consumption levels, there are reports that people with greater water consumption may benefit more compared to those with less. Dehydration has been linked to increases in risks of urinary tract infections, dental disease, constipation, kidney stones and impaired cognitive function. Higher fluid intakes have been associated with reduced risks of urinary tract stones, colon and urinary tract cancer, and mitral valve prolapse in some studies. More research is necessary on this appealing hypothesis.

Conclusions: How do these approximate values compare to AIs and regulatory default assumptions?

It is clear that the actual water consumption in the U.S. is below the recommended AI values for almost every age group. Some additional water is provided by metabolism and nontap water sources, but the AI values would not likely be exceeded in many cases except perhaps for active high consumers.

Regarding the default water consumption values of two liters per day for adults and one liter per day for a 10 kg child, approximately 90 percent of adults are consuming two liters per day of tap water or less, and almost all very young children are consuming about one liter of tap water per day or less. So, water consumption levels indicate that drinking water standards are generally protective of the population and have greater margins of safety for essentially all very young children and virtually all adults. Additional conservatism is embedded in calculations of drinking water standards by inclusion of relative source contribution factors attributable to drinking water as a source. The usual default value is 20 percent which results in additional safety.

There are several studies indicating potential health benefits from long-term consumption of greater amounts of water, which is worth exploring further.

So, today’s take-home message is: More water and a little more salt is good for people with more strenuous activity. And, the good news is that community tap water in the U.S. is safe almost everywhere.

Sources

  • Water requirements, impinging factors and recommended intakes. Ann C. Grandjean, in Nutrients in Drinking Water, World Health Organization, Geneva, 2005. ISBN92 4 159398 9.
  • EPA estimated per capita water consumption in the U.S. EPA-822-00-008, April 2000.
  • The mineral composition of water and its contribution to calcium and magnesium intake. CN Ong, AC Grandjean and RP Heaney, in calcium and magnesium in drinking water, JA Cotruvo and J Bartram eds. World Health Organization, Geneva, 2009. ISBN 978 92 4 156355 0.

Dr. Cotruvo is president of Joseph Cotruvo and Associates, LLC, Water, Environment and Public Health Consultants. He is a former director of the U.S. EPA Drinking Water Standards Division.

Sedentary, temperate env. Physically active/increased temperature
Female adult 2.2 4.5
Male adult 2.9 4.5 – 11.0

Sponsored Recommendations

Meet the future of MV switchgear

SureSeT new-generation metal-clad. Smarter. Smaller. Stronger.

A digital circuit breaker built for the future

EvoPacT medium voltage digital vacuum circuit breaker

The New Generation of Intelligent MV Switchgear

Step into the future of electrical infrastructure with Intelligent MV Switchgear - where traditional equipment becomes smart, providing real-time data on critical components like...

Switchgear goes digital with SureSeT

Discover what you can do with Square D natively digital MV metal-clad switchgear.