Monitoring helps wastewater plant achieve clean optimization
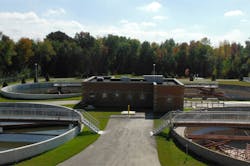
Keswick was once a rural community on the shores of Lake Simcoe in Ontario, Canada. It is now a bustling commuter hub because of growth in the Greater Toronto Area, and its wastewater treatment had to grow and change accordingly.
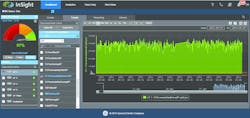
Figure 1. The remote monitoring and diagnostics platform (Click to view larger.)
In 1984, the Ontario Ministry of Environment and Climate Change constructed the Keswick Water Resource Recovery Facility (WRRF). In 1997, ownership transferred to the Regional Municipality of York (York Region), and tertiary treatment was later added. The extended aeration plant manages and treats municipal wastewater from the community of Keswick within the town of Georgina. To meet the demands of the growing community, York Region wanted to expand its 3.2 million gallon-per-day (mgd) plant.
Keswick WRRF was expanded to 4.75 mgd in spring 2013 with five trains equipped with 1,000 membranes. The membranes enabled York Region to meet the most stringent effluent compliance limits for phosphorous in Ontario and Canada.
Along with the installation, York Region chose to add a monitoring and optimization consulting service that automatically collects water process and quality data from the plant’s membrane system. This data is then digitally fed into an industrial Internet platform and converted into graphical reports for trending and analysis. An expert process analyst uses the platform in partnership with York Region staff to monitor the data, assist the operators with interpreting the results and make recommendations to enhance operational performance.
The process analyst assigned to the plant helps troubleshoot issues and looks for opportunities to improve efficiency while optimizing the system’s operation. To improve plant performance, the process analyst develops a hypothesis and tests it while monitoring the effect it has on the plant.
Solution
To help optimize the plant and reduce costs, the process analyst worked with York Region operators to gradually reduce the amount of maintenance cleans required each month and monitored the plant’s performance as part of the consulting service. The analyst wanted to see if this reduction could save the plant money by decreasing chemical use while maintaining optimum performance.
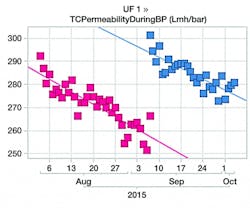
Figure 2. Comparison of the decrease in permeability between two maintenance clean schedules (Click to view larger.)
When a recovery clean is performed, the permeability of a plant increases, followed by a slow decrease until the next recovery clean. Maintenance cleans are performed more consistently to help decrease the descent of permeability in between recovery cleans. The performance of a maintenance clean schedule can be measured by how quickly the permeability decreases after a recovery clean.
After implementing a new maintenance clean schedule, the decrease in permeability was very similar to the previous cleaning schedule (see Figure 2). From this data the analyst concluded that the maintenance clean reduction did not negatively affect membrane performance.
The new maintenance clean schedule allowed the plant to save money by reducing the amount of chemicals used. The schedule reduced the amount of sodium hypochlorite maintenance cleans from 20 to 15 per week. Additionally, the citric acid maintenance cleans that were being used five times per week were no longer needed under the new schedule.
The recovery clean schedule was optimized as well. The low pH recovery cleans were reduced from 60 to 30 per year. The sodium hypochlorite recovery cleans were reduced from 60 to 50 per year. This again helped reduce chemical costs without compromising performance.
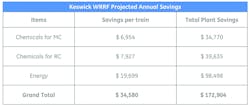
Table 1. Projected annual savings
In addition, the process analyst was able to optimize the chemical dosage per clean, which helped ensure that the proper amount of chemical was being used. This helped make sure that the membranes were being cleaned fully. Cleaner membranes resulted in a lower transmembrane pressure during production, which translated to lower permeate pump energy costs.
During cleaning, the water is heated to enhance the chemicals’ effectiveness. Additional savings came from scheduling cleans during off peak times to benefit from a reduced energy cost rate.
Results
The new maintenance clean schedule at Keswick was completely implemented after successfully maintaining performance throughout the testing trials. The reduced recovery clean test trials are expected to be fully completed in the coming months.
Once the cleaning optimization is fully implemented, the customer is expected to save approximately $173,000 annually. The cost of the monitoring and optimization service was only a small fraction of the annual savings, representing a great return on investment for the Keswick WRRF.
Jim Imrie is general manager of life-cycle services for GE Water & Process Technologies, based in Ontario, Canada. As the services product line leader, he oversees development and delivery strategies for parts/material services in support of the company’s install base. For more information, visit gewater.com.