ZLD Today, Part 1--Matching Water Treatment Options to Power Plant Requirements
by William E. Moore and Timothy J. Rittof
Waste systems of an electric power generating station are surprisingly challenging to both chemists and chemical engineers. That challenge is a two-part one: 1) Water must be made available for the various station uses and be of appropriate quality and, 2) the resulting wastewater streams must be handled in an appropriate manner. That manner is frequently zero liquid discharge (ZLD).
The station’s water uses have capacity demands that vary from a few hundred gpd (potable water) to thousands of gpm (cooling tower makeup); and purity requirements that vary from a few ppb (injection water) to over a thousand ppm (again, cooling tower makeup).
Variability of resulting wastewaters is no less daunting. Polishing demineralizer regeneration waste is, arguably, the easiest - leave it for the service DI supplier. Flue gas desulfurization (FGD) blowdown is the most difficult - high chloride, high dissolved solids and saturated with calcium. In this article, we’ll leave FGD blowdown alone and deal with the most common problem - cooling tower blowdown (CTBD).
Power Generation Design
• Simple Cycle: A simple cycle system is an engine directly connected to a generator with no heat recovery. The lowest volumetric demand for water comes from the simplest of the engine-driven generating installations. If the engine is a piston engine, the only requirement is for cooling of the lubrication oil. The gas turbine engine adds the use of water for inlet gas cooling and for NOx suppression.
All installations have a demand for both potable and process water. Depending on availability of “city water,” only one supply may be needed. Likewise, depending on permit requirements and the availability of “city sewer,” discharge treatment may be limited to an oil separator.
Although the volumetric demand of the simple-cycle is low, the requirement for process water quality is not. A quality standard for the water used in the gas turbines is specified by the supplier and is more stringent than most steam turbine specifications and all boiler specifications.
• Combined Cycle: The addition of a heat recovery steam generator (HRSG) and steam turbine to the gas turbine exhaust brings us the combined cycle generating station.
This change doesn’t increase the stringency of the required water quality but it does change the required water volume. The steam turbine requires a heat sink - a condenser and cooling tower.
• Coal-fired: At their simplest, the water quality demands of the coal-fired power plant are often less stringent than those of the gas-fired turbine plant. But, they’re more varied and substantially larger. The coal-fired plant has coal transport, ash disposal, fly ash collection and fly ash disposal and flue gas desulphurization to consider.
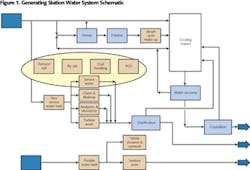
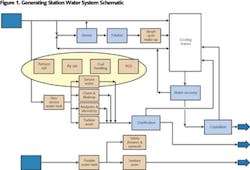
If we lump these additional considerations under “Service Water,” the water flow diagram for the coal-fired plant (see Figure 1) is very close to that of the combined cycle gas turbine plant.
The combined cycle gas-fired turbine generating plants are significantly more efficient in converting heat to electricity than their fired boiler siblings. This translates into less wasted heat and less water evaporation to carry the waste heat away. Table 1 shows a comparison of the water demands of the conventional thermal-based power generation schemes. Coal requires twice the water of combined cycle gas turbine.
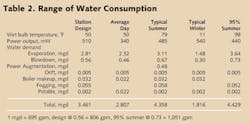
Simple values like gallons per kilowatt-hour (gal/kWh) are very useful for comparisons but not for design. A real operating evaluation is much more complex. Operation throughout the year must respond to ambient temperature, humidity, regional power demand, and power selling price. The station operator will adjust the amount of inlet air cooling and cooling tower blowdown; the amount of power augmentation; maybe even duct firing. Depending on the particular situation we pick, the water demand can be as low as 0.15 gal/kWh or as high as 0.37 gal/kWh. A coal plant has a similar range - just twice as large. So, we have our first water system design choices: how much water and wastewater storage and how much wastewater processing capability. If the station is not ZLD, selecting how big the wastewater pipe will be is a fairly simple matter. In general, any ZLD design capacity above the requirement of “station design” should be carefully (re)considered. The higher demand cases rarely (if ever) last more than 16 hours out of 24 and this can readily be covered by tankage. Tanks are cheaper than processing equipment.
Source Water Character
Now that we have the water demand in hand, we face the interesting task of finding a source and deciding what to do with it. We may use surface, well or reclaim water. We may have reclaim water meeting California Title 22 standards or we may have an industrial water meeting no known standards. We may have only brackish water or seawater. The sequence we suggest to examine the water character and to determine water treatment is: 1) suspended matter, 2) chemical composition, and 3) organic matter.
Suspended matter is chosen first because it’s the most clear. The suspended solids concentration in the cooling tower needs to be limited - usually to less than 100 mg/L. If the supply water contributes more than this, clarification or filtration (or both) - either supply or side stream - is needed. The portion of the water supply sent to the boiler makeup water demineralizer always needs filtration.
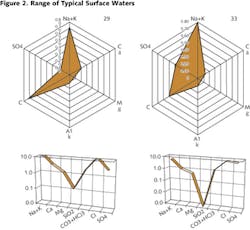
Chemical composition is the fun part - at least for a water chemist. It would be nice to have a simple, clear method to analyze and to present the character of water chemistry and implications for treatment. In the mean time, there’s a choice of pictorial representations and diagrams: Ternary, Jäneke, Piper, Durov, Stiff, Schoeller. We usually choose to use two plots that everyone can prepare and seem to fit our needs quite well: the radial (or radar) diagram and the Schoeller diagram. The radial diagram presents the relative contribution of the major constituents reported as calcium carbonate or as “equivalents.” This a modification of the Stiff diagram and is readily presented from spreadsheet software. Unfortunately, the radial diagram doesn’t represent the total concentration of dissolved matter. For that, we use the Schoeller chart, which is a category plot of the log of the equivalent concentration for the major constituents. Again, the charts are easily prepared by spreadsheet software. Examples of the radial diagram and Schoeller charts are shown in Figure 2.
Conclusion
In Part II of this article, we’ll just discuss the major constituents. At some time (preferably before commissioning) all of the bad actors - scale formers, concrete and metal corrosive agents, and biological food sources - must be considered.
About the Authors: William E. Moore is a senior water treatment specialist at Calpine Corp. of Houston, TX. Timothy J. Rittof is a senior technical fellow at HPD, a Veolia Water Solutions & Technologies company based in Plainfield, IL, that manufactures crystallization, evaporation, distillation and membrane separation systems. This two-part series is based on a paper presented at the 66th International Water Conference in Orlando, FL, in October 2005. Contact: 800-927-0319 or [email protected]


